
Litecoin Price Technical Analysis for 31/3/2015 - Bearish Control
Litecoin has been bearish since finding resistance in March at 2.14. The 4H chart shows a market that made a price top around 2.00 when it fell below support at 1.97. Since the slide, the market has reached a low around 1.60. ltcusd has broken below the 200-, 100-, and 50-period simple moving averages (SMAs) in the 4H chart. Also, the moving averages have shifted from sloping up with bullish alignment to sloping down with bearish alignment. (Bearish alignment = 200- above 100- above 50-period SMAs). Litecoin (LTCUSD) 4H Chart 31/3. As we begin the week, it looks like the bears in March are....
Related News
Not much happened today in the price action of litecoin. As we can see in the 1H chart, price has been drifting sideways since the cryptocurrency rallied from around 1.60 to about 1.82. While price is indeed still in this consolidation range, we can see a bearish bias. Litecoin (LTCUSD) 1H Chart April 1, 2015. 1) The 200-, 100-, and 50-hour simple moving averages (SMAs) are in bearish alignment and are sloping down. 2) Price is starting to hold below the cluster of these SMAs, which shows bearish bias. 3) The RSI has held below 60, and has tagged 30, showing development of bearish....

Litecoin has dropped 6.47 percent to trade at $2.733 as the underlying negativity comes to the fore. We discussed in the previous Litecoin price technical analysis The Pressure is Evident that there is a very low probability of the price trending higher and that bears may make an early comeback. This decline has also brought the price closer to its very important technical support of the 200-day simple moving average (SMA). The question that the trading community is now asking is: will this level cushion Litecoin once again? I continue to remain bearish on Bitcoin as well, which I believe....

Litecoin has expectedly obliged us with a 13 percent drop during the weekend as Bitcoin crumbles under pressure. We discussed in Bounces Off Support that even while the technical indicators were positive for Litecoin, we must remain on the short side. And that has paid off well; the cryptocurrency succumbed to a low of $3.852 before recouping some losses. Now at $4.041, Litecoin is still in tight clutches of the bears. Technical analysis of the daily LTC-USD price chart reveals that Litecoin may witness jettison by the bulls as bearish pressure mounts, and that we may see a new low in the....

Following the lead of Bitcoin, Litecoin has gained 5.69% over the weekend. The advance has also brought the price closer to its resistance zone, beyond which Litecoin may witness a massive rally. Litecoin is currently trading at $3.047. In my previous analysis titled This Market is not for the Greedy!, I had suggested that Litecoin be shorted by keeping a strict stop-loss above $2.980. Those who would have followed this advance would have minimized their losses significantly. Technical analysis of the 240-minute LTC-USD price chart points to a probability that the cryptocurrency may, in....
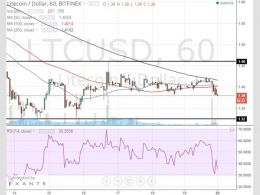
After making a low at 1.32 last week, litecoin has been in consolidation. The 1H chart shows the narrow consolidation range between 1.32 and 1.46. Litecoin (LTCUSD) 1H Chart April 20. Here are some observations from the 1H chart:1) The market has been relatively quiet over the weekend, but after price met with the 200-hour simple moving average (SMA), there was a bearish reaction. This shows that bears are in control. 2) The RSI shows a market in consolidation. It is now heading to 30, which could be a sign that the market is reviving the bearish momentum. If the RSI tags 30, and holds....