Bitcoin Price Technical Analysis for 1/4/2015 - Coiling Begins
Bitcoin has been consolidating since the end of last week after it tagged the 236 handle. BTCUSD rebounded from 236 to about the 255-256 area before stalling. Over the weekend and at the start of the week, we saw the cryptocurrency slide back towards that 236 low, but respecting it as support again. The 1H chart shows the strong rebound from the support area, which sets up a potential double bottom. Bitcoin (BTCUSD) 1H Chart 1/4/2015. In the 1H chart we can see that before a double bottom is complete, price action has some slight bearish bias. Indeed before this possible double bottom,....
Related News
Litecoin continues to consolidate. In the 1H chart below we see a sideways range roughly between 1.80-1.90. Litecoin (LTCUSD) 1H Chart 25/2/2015. Here are some observations:1) The 200-, 100-, and 50-hour simple moving averages (SMAs) are clustered together. This reflects a market that not only has no direction, but has very low volatility. 2) Price has been whipping over and under the cluster of SMAs. This also reflects indecision, but we can already see that by looking at the sideways price action. 3) The RSI has tagged 30, but has been holding below 60 for the most part. This actually....
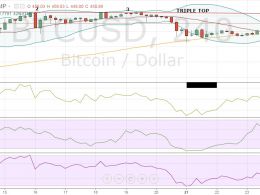
The Christmas isn’t turning out to be merry for Bitcoin. The cryptocurrency is struggling near the overhead resistance of $465. It is now trading 1.28% lower at $450.89, raising concerns that the market participants might pull out their funds in the holiday season. As a result, several technical indicators are also showing declines. We advised in the previous Bitcoin price technical analysis Target Achieved that traders should book at least partial profits in their long positions. And for today’s analysis, we will again be using the 4-h BTC-USD price chart from BITSTAMP.
Litecoin has jumped more than 10 percent over the weekend as Bitcoin broke past a crucial resistance level. Now trading at $2.950, Litecoin hit a high of $3.066 before easing a bit. So, will Litecoin head even higher or is this when the rebound fails? Well, it is very hard to say that right now but a clearer picture can definitely be obtained by using some technical indicators and taking cues from the expected Bitcoin price action. Litecoin Chart Structure - The Resistance can be obtained by connecting the tops of Litecoin for the month of August and it is near $3.400. This is also the....
Bitcoin rises more than 2 percent to $430.21, nearing our year-end target of $440. In the previous price technical analysis A No Trade Market, we mentioned that an increasing MFI often causes price appreciation, and we are witnessing just that. The question now is: Would bitcoin be able to extend the gains or will it retrace its steps? Let us try to predict this with the help of technical analysis conducted on the 240-minute BTC-USD price chart. Bitcoin is well poised to increase its duration inside the $400-440 range, at least for the next couple of sessions. There is a high probability....
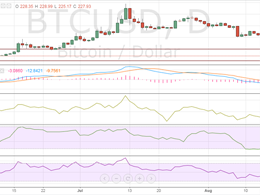
In the previous Bitcoin price technical analysis Rebounds, we discussed how the cryptocurrency was erasing the losses for the past week. But, the entire positivity was put to rest over the weekend as bears made a comeback and long positions were fast liquidated at the slightest hint of a pullback. Bitcoin, which is now trading at $227.93, has once again come closer to its important buying interest zone of $220-225. As the price decline has pushed the price closer to its crucial support, market participants may also be factoring in a breach of support this time, but I would recommend....


