Bitcoin Price Technical Analysis for 14/7/2015 - Support Holds
Bitcoin dived more than 8 percent as it became clear that Greece would do everything to remain in the Eurozone. The Alexis Tsipras-led government has struck a deal with its creditors yesterday, and a Grexit has been more or less ruled out. Post the announcement, Bitcoin fell from our previous observation of $307.87 to a low of $281 but soon trimmed the losses and is now trading at $293.68. Until the support line, drawn in the daily BTC-USD chart above is not violated, bulls will have the upper hand. Bitcoin Chart Structure - As the price approached the support line following the collapse,....
Related News
Litecoin falls 1.47 percent to $3.075 after kissing the resistance at $3.130. In the previous Litecoin price technical analysis, we said that Litecoin could leapfrog to higher levels on consistent support from the buyers, but what we have got instead is a bout of profit booking which once pulled down the price to an intraday low of $3.050. But can this decline prove fatal to Litecoin? Will the crucial support of $3.000 be breached? Let us try to find that out by conducting a technical analysis on the daily LTC-USD price chart. Litecoin Chart Structure - As can be seen, the higher top,....
Litecoin fell more than 5 percent over the weekend as weakness returned to haunt the cryptocurrency markets. The Bitcoin market is also struggling to cope with the selling pressure and has returned to its crucial support of $220. Litecoin is currently trading at $3.330 and is well within its medium term trading range. In the previous Litecoin price technical analysis Sell on Rallies, we discussed how Litecoin remains weak and any rise in the valuation can be used to go short. That holds valid for even today. The latest technical indicators are nowhere positive or indicate that a reversal....
Litecoin has been consolidating since finding support at 1.32 This consolidation follows a 3-point divergence between price and the RSI. Then, after a failed bearish attempt to test 1.32, price rallied again and rallied up to 1.46 before finding resistance. Litecoin (LTCUSD) 1H Chart April 17. In the 1H chart, we can see that there was resistance around 1.45-1.46, which was a common support from a previous consolidation. As price falls, we should watch what happens around 1.37. If ltcusd breaks below 1.37, it would break below the 100-, and 50-hour simple moving averages (SMAs) and this....
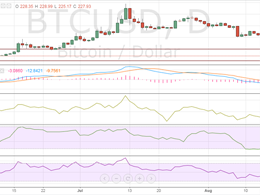
In the previous Bitcoin price technical analysis Rebounds, we discussed how the cryptocurrency was erasing the losses for the past week. But, the entire positivity was put to rest over the weekend as bears made a comeback and long positions were fast liquidated at the slightest hint of a pullback. Bitcoin, which is now trading at $227.93, has once again come closer to its important buying interest zone of $220-225. As the price decline has pushed the price closer to its crucial support, market participants may also be factoring in a breach of support this time, but I would recommend....
Bitcoin has hit the ground with a thud as bulls ran out of fuel in the middle of this week. The decline of the past 3 sessions has undone all the hard work done by the buyers after the price hit a low of $261. Bitcoin is now trading at $262.22, down 1.84 percent. It has hit an intraday low of $262. And I am sensing more pain if $260 is breached. Take a look at the technical picture of the daily BTC-USD price chart below. Bitcoin Chart Structure - Bitcoin has witnessed an incessant selling pressure after it hit its recent high of $271.50. If the cryptocurrency holds its base of $260, then a....


