Dash Price Technical Analysis - 0.0125BTC as a Barrier
Dash Price Key Highlights. Dash price declined yesterday, as forecasted, but found support around an important support area of 0.0125BTC. A bullish trend line was broken, which might act as a resistance in the near term. A bearish trend is formed, which is stalling upsides and could ignite a downside reaction moving ahead. Dash price after sliding found support around 0.0125BCT which represents a major pivot area for both sellers and buyers. More Losses Likely. Yesterday, we highlighted a bullish trend line on the hourly chart, which was breached recently by sellers. However, the downside....
Related News
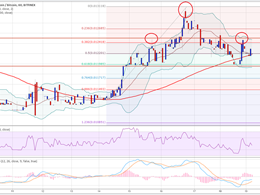
Key Highlights. Dash continues to struggle, as the shoulder resistance (highlighted in yesterday's analysis) at 0.0125BTC stalled upsides on many occasions. As long as the prices are below 0.0125BTC, Dash might head lower. Our highlighted head and shoulders pattern is still valid, and if bears gain control, we might witness a pullback in Dash. 0.0125BTC as a Hurdle. Dash settled above the 100 hourly simple moving average, which took the price towards 0.0125BTC. The mentioned level represents a shoulder resistance area of the head and shoulders pattern as highlighted in the chart attached.....
Key Highlights. Dash price after surging higher corrected lower as forecasted in the weekly analysis. There is a major support building around 0.0125BTC, which is likely to act as a pivot area. A bullish trend line is also formed, which is a crucial barrier for sellers. Dash price correction phase is likely to complete soon, which means buyers might take control in the near term. 0.0125BTC as a support. As highlighted in the weekly analysis, the Dash price surged higher after clearing a couple of major resistances like 0.0120BTC and 0.0125BTC. The upside after the break was stalled around....
Key Highlights. Dash price traded lower but found support around an important area of 0.0125BTC where buyers defended the downside successfully. There is a bullish trend line formed on the hourly chart, which might provide support moving ahead. A break above 0.0130BTC might ignite more gains in the near term. Dash price struggle continues, which could ignite a downside thrust if buyers fail to defend an important support at 0.0125BTC. 0.0125BTC as a barrier. We highlighted time and again that there is a major support around 0.0125BTC, which acted as a hurdle for both buyers and sellers on....
Key Highlights. Dash after trading lower found support around 0.0120BTC as forecasted in yesterday's post. It looks like it is forming a head and shoulders pattern, which might ignite a bearish wave in the short term. There are a few important things to note from the hourly chart of Dash, which points that if sellers gain control, more downsides are likely. Head and Shoulders Pattern. There is a monster support around 0.0120BTC, which acted as a barrier for sellers. Dash is currently moving back higher, but buyers need to be very careful as it looks like there is a chance of Head and....
Dash Price Key Highlights. Dash price moved lower Intraday, and managed to test a major support area around 0.0125BTC. If there is a break and close below 0.0125BTC the price might fall in the near term. 100 simple moving average on the 4-hours chart is likely to act as a resistance. Dash price is showing signs of weakness, which might take it lower moving ahead if sellers gain pace. Can it trade lower? The Dash price moved a bit lower yesterday, and tested an important support area of 0.0125BTC which holds the key in the near term as highlighted in one of the recent analyses. There lies a....


