Dash Price Technical Analysis - Break Pattern
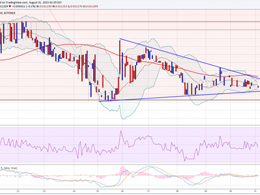
Dash Price Key Highlights. Dash price looks like completed a 5-waves up pattern and might head lower in the near term. There is a Triple top pattern formed (as highlighted yesterday), which could push the price lower. Besides, there is a bullish trend line formed, which must be cleared for more losses in the near term. Dash price might have created a short-term top, as there is a wave sequence completed on the hourly chart. 5-Waves Pattern. As mentioned in yesterday's post, we are waiting for a break in the Dash price. There are a couple of important things formed on the hourly chart,....
Related News

Dash Price Key Highlights. We highlighted yesterday that the Dash price might have completed a 5-waves up pattern and could move lower in the near term. There was a break lower, as the price moved below a major trend line support area to test 0.0124BTC. The Triple top pattern formed was valid and helped sellers to gain control. Dash price finally moved lower and cleared a critical support area to open the doors for more losses. Downside Break. As mentioned in yesterday's post, we highlighted a couple of important patterns and were waiting for a break in the Dash price. There was a break....
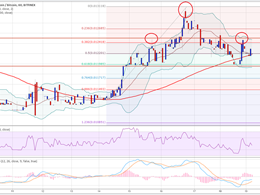
Key Highlights. Dash after trading lower found support around 0.0120BTC as forecasted in yesterday's post. It looks like it is forming a head and shoulders pattern, which might ignite a bearish wave in the short term. There are a few important things to note from the hourly chart of Dash, which points that if sellers gain control, more downsides are likely. Head and Shoulders Pattern. There is a monster support around 0.0120BTC, which acted as a barrier for sellers. Dash is currently moving back higher, but buyers need to be very careful as it looks like there is a chance of Head and....
Key Highlights. Dash continues to struggle, as the shoulder resistance (highlighted in yesterday's analysis) at 0.0125BTC stalled upsides on many occasions. As long as the prices are below 0.0125BTC, Dash might head lower. Our highlighted head and shoulders pattern is still valid, and if bears gain control, we might witness a pullback in Dash. 0.0125BTC as a Hurdle. Dash settled above the 100 hourly simple moving average, which took the price towards 0.0125BTC. The mentioned level represents a shoulder resistance area of the head and shoulders pattern as highlighted in the chart attached.....
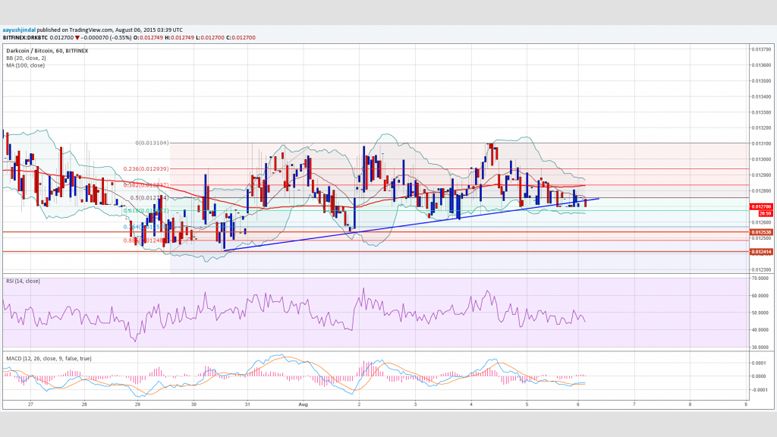
Dash Price Key Highlights. Dash price struggled to trade higher and continued to trade in a range with a major support at 0.0110BTC. There is a contracting triangle pattern formed on the hourly chart, which might act as a catalyst for the next move. One bearish sign is that the price is struggling to clear the 100 hourly simple moving average. Dash price trading in a range, but looks poised for a short-term break as there is a triangle pattern forming on the hourly chart. Break Ahead? The Dash price continued to weaken and failed on many occasions to trade below 0.0110BTC. The most....

Dash Price Key Highlights. Dash price made another attempt to trade above 0.0130BTC, but failed. It looks like there is a double top pattern forming, which if turns out to be true might push the price lower. The price has settled below the 100 hourly simple moving average, which is a bearish sign in the short term. Dash price failing around 0.0130BTC is a warning sign and might take it lower moving ahead. Channel Break. We were anticipating a break in the Dash price this past week, and that did happen. The price moved higher, but found resistance around 0.0130BTC which ignited a downside....