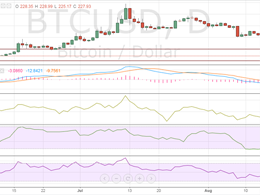
Bitcoin Price Technical Analysis for 10/8/2015 - An Expected Decline
In the previous Bitcoin price technical analysis Go Short Now!, it was explicitly stated that the current action in Bitcoin would lead to a big decline in Bitcoin and that short positions should be created. As can be seen, Bitcoin did crash down to $260, slightly above my target of $257 over the weekend. Bitcoin is currently trading down 4.34 percent at $265.06. But, the big question now is: What to do? Should we stay short or should we book profits? As the technical indicators approach oversold levels, it's best to practice a bit of caution. Read on below the latest technical indications....
Related News
In the previous Bitcoin price technical analysis Rebounds, we discussed how the cryptocurrency was erasing the losses for the past week. But, the entire positivity was put to rest over the weekend as bears made a comeback and long positions were fast liquidated at the slightest hint of a pullback. Bitcoin, which is now trading at $227.93, has once again come closer to its important buying interest zone of $220-225. As the price decline has pushed the price closer to its crucial support, market participants may also be factoring in a breach of support this time, but I would recommend....
Litecoin falls 1.47 percent to $3.075 after kissing the resistance at $3.130. In the previous Litecoin price technical analysis, we said that Litecoin could leapfrog to higher levels on consistent support from the buyers, but what we have got instead is a bout of profit booking which once pulled down the price to an intraday low of $3.050. But can this decline prove fatal to Litecoin? Will the crucial support of $3.000 be breached? Let us try to find that out by conducting a technical analysis on the daily LTC-USD price chart. Litecoin Chart Structure - As can be seen, the higher top,....
Bitcoin prices have dropped more than 4% after it became official that Greece would receive funding from both the ECB and the EU and that the Greek banks will open from Monday. In my previous analysis titled Awkward Calmness, I mentioned that a major move was expected in the Bitcoin market and I think now might be a good time for that. Bitcoin is currently trading down 4.18% at $277.84. Technical analysis of the Daily BTC-USD price chart above confirms that the market has reached the support level and buying can be initiated but strict stop-loss should be put in place. Bitcoin Chart....
We had discussed in the previous Bitcoin price analysis Breakdown Coming? that Bitcoin is expected to breach the floor of the descending triangle, and according to the latest price action and the technical indications, the probability of that happening has increased significantly. Bitcoin is currently trading down 1.41% at $277.10. Technically, both the price action and the technical indicators have turned extremely bearish for Bitcoin, implying that more pain is coming for the cryptocurrency. Bitcoin Chart Structure - With the latest decline, Bitcoin has slumped to a new weekly low of....
Litecoin has dropped 6.47 percent to trade at $2.733 as the underlying negativity comes to the fore. We discussed in the previous Litecoin price technical analysis The Pressure is Evident that there is a very low probability of the price trending higher and that bears may make an early comeback. This decline has also brought the price closer to its very important technical support of the 200-day simple moving average (SMA). The question that the trading community is now asking is: will this level cushion Litecoin once again? I continue to remain bearish on Bitcoin as well, which I believe....


