Bitcoin Price Technical Analysis for 21/9/2015 - A Disappointing End to the Week!
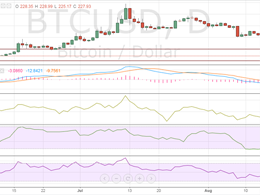
Last week ended on a very disappointing note for Bitcoin market traders and speculators as the cryptocurrency failed to budge beyond a certain, small range. Many of the market participants expected Bitcoin to move as the week came to a close, but nothing significant was seen. Bitcoin is currently trading at $228.90, closer to its support zone of $220-225. Even though the price action has been sort of dull, the technical indicators have undergone changes. Let us find out below which ones are telling what. Bitcoin Chart Structure - As you can see, Bitcoin traded in a small range of $223-246....
Related News
After diminishing the gains over the weekend, Bitcoin has started this week on a poor note. The virtual currency has failed to respect the crucial support zone of $236-238, and now runs the risk of a huge decrease in the market cap. Hopes are high that the level of $234 may not get violated very soon. Each Bitcoin can currently be bought for $235.98, 1.05% cheaper than yesterday's $238.50. Upon technically analyzing the 240-minute BTC/USD price chart, it can be concluded that all is not yet lost for the virtual currency. Bitcoin Chart Structure - After failing to sustain at higher levels,....
In what appears to be the first conclusive sign of an upcoming breakdown, Bitcoin ended yesterday's trading session at the lowest closing for September-to-date. And currently, Bitcoin seems to be staging a fake pullback to entice more market participants to go long without reading too much into the breakdown. Bitcoin is currently trading at $227.92 and the resistance is now at $228.60. In the previous Bitcoin price technical analysis A Disappointing End to the Week!, we discussed how the technical indicators were reflecting the bearish sentiments in Bitcoin, and today, we are going to....
Sellers continue to run amok in Darkcoin as the price plunges to new lows. Thanks to the sell-off, each Darkcoin has gotten significantly cheaper and can be bought for 0.0172BTC. Investors may also consider adding to their long positions as the price nears a crucial support level. The 240-minute DRK/BTC price chart above, taken from bitcoinwisdom.com, has been analyzed using technical analysis to reveal some noteworthy points from a trading perspective. Chart Structure - The price trend has been disappointing, to say the least. Ever since Darkcoin hit a high of 0.02495BTC, price has been....
After falling to multi-week lows to start the week, BTC rebounded back above the $40,000 level on Tuesday. Today’s surge in price comes as ETH also rallied, climbing beyond the $3,000 point for the first time in three days.
Bitcoin
Following a disappointing start to the week, bitcoin saw its price rebound during Tuesday’s session, as bulls returned to action.
Monday saw BTC fall to a bottom of $38,708.50, which was its lowest point since mid-March, however it has since regained momentum.
This momentum has seen BTC/USD rally to an intraday....
In the previous Bitcoin price technical analysis Rebounds, we discussed how the cryptocurrency was erasing the losses for the past week. But, the entire positivity was put to rest over the weekend as bears made a comeback and long positions were fast liquidated at the slightest hint of a pullback. Bitcoin, which is now trading at $227.93, has once again come closer to its important buying interest zone of $220-225. As the price decline has pushed the price closer to its crucial support, market participants may also be factoring in a breach of support this time, but I would recommend....


