
Dogecoin Price Technical Analysis - Super Long-Term Trend Line Intact!
Dogecoin Price Key Highlights. Dogecoin price has been steadily trending lower, moving below a very long-term trend line visible on the daily and 4-hour charts. Price recently made a strong bounce up to the long-term resistance area, which continued to keep gains in check. Dogecoin price is set for further losses, as the descending trend line held as resistance and technical indicators support a continuation of the downtrend. Aiming for Previous Lows. With that, dogecoin price is back on track to test the previous lows around 36 Satoshis. Strong bearish momentum might even lead to a break....
Related News

Key Highlights. Dogecoin price looks like forming a short-term base near 32.2 Satoshis, as shown on the hourly chart (price feed from HitBTC). The price may bounce from the current levels, but could find resistance near 35.0 Satoshis. Selling rallies may be a good deal moving ahead as long as the price is below the mentioned resistance area. Dogecoin price may recover in the near term, but we cannot discard the fact that there is a lot of bearish pressure, calling for sell rallies idea. 35.0 Satoshis as Resistance. Dogecoin price found bids near 30-32.0 Satoshis, and currently attempting....

Dogecoin Price Key Highlights. Dogecoin price has been trading below a long-term descending trend line for quite some time, but reversal signals are showing up. Price made a sharp upside breakout, hinting that the downtrend might already be over and that it's time for buyers to take charge. Dogecoin price could be in for more gains, as it made a convincing breakout from the descending trend line connecting its latest highs. Waiting for Technical Confirmation. Technical indicators have yet to confirm the dogecoin price rally since the 100 SMA remains below the 200 SMA for now. This suggests....
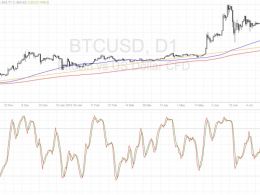
Bitcoin price is still hovering close to the long-term rising trend line but could be trying to resume its rally. Bitcoin Price Key Highlights. Bitcoin price has been trending higher on its longer-term time frames, moving above a rising trend line visible on the daily chart. Price recently tested the trend line support and made a bounce, which suggests that bulls are intent on keeping the uptrend intact. The rally is still finding legs but there are technical arguments for a continuation of the climb. Technical Indicators Signals. The 100 SMA is above the longer-term 200 SMA on this time....

Key Highlights. Dogecoin price weakened Intraday, as forecasted recently, but there was a sharp reaction around 68.0. A bearish trend line as highlighted yesterday is acting as a resistance for more upsides. A failure to break the stated trend line might ignite a down-move in the near term. Dogecoin price was completely rejected around 68.0 Satoshis, but the bearish trend line holds the key moving ahead. Trend Line as Pivot. Dogecoin dived Intraday after a rejection around an important bearish trend line on the hourly chart. The price cleared a monster support area of 70.0 Satoshis to....

Today, Bitcoin price sank below $40,000 for the first time since September – a price more than 50% lower than what the market was anticipating this time of year. While the downside has been impossible to ignore, the latest sweep of lows has resulted in a touch of a trend line dating back to the bear market bottom that could keep the bull market intact a bit longer. Technical Analysis And Framing The Importance Of Trend Lines When it comes to technical analysis in Bitcoin, trend lines always matter. When such lines hold, it is a sign to the market that it is time to reverse. When they give....