Ethereum Price Technical Analysis for 12/11/2015 - Testing Channel Support!
Ethereum Price Key Highlights. Ethereum price seems to be recovering from its earlier drop, as it is trying to establish a new uptrend visible on its 1-hour time frame. Price is moving slowly inside an ascending channel and is currently testing support. Ethereum price might be able to sustain its short-term climb, with technical indicators and candlestick patterns suggesting a bounce. Bullish Divergence Seen. Stochastic has made a shallow bullish divergence, with price forming lower lows and the oscillator drawing higher lows. This indicator is heading higher, which suggests that ethereum....
Related News
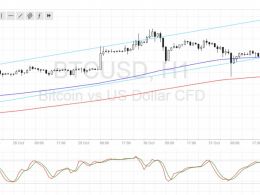
Ethereum Price Key Highlights. Ethereum price is slowly trending higher on its 1-hour chart, after having completed a pullback bounce and resuming its trend. Price is moving inside a short-term rising channel and is currently testing the resistance near the 0.00300 major psychological mark. Ethereum price could be due for a selloff back to the channel support before the ongoing climb resumes. Buyers Need a Break. Technical indicators seem to be suggesting that the recent rally is overdone, with stochastic already turning down from the overbought zone and indicating a return in bearish....
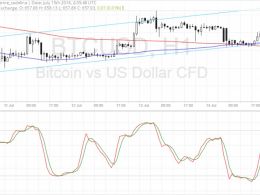
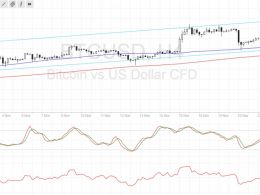
Bitcoin price is testing the ascending channel on the 1-hour time frame, still deciding whether to go for a continuation or a reversal. Bitcoin Price Key Highlights. Bitcoin price has been edging lower recently but the overall uptrend on the short-term chart seems intact. Price is still inside its ascending channel and is currently testing the support. A bounce could confirm that bulls are still in control of bitcoin price action while a breakdown would suggest that a downtrend is in order. Technical Indicators Signals. The 100 SMA is above the 200 SMA, which means that the the path of....
Bitcoin price is testing the ascending channel support visible on the 4-hour time frame and could be gearing up for another rally. Bitcoin Price Key Highlights. Bitcoin price is still trending higher on its 4-hour chart and moving inside the ascending channel previously marked. Price has pulled all the way back to the channel support around $740-745 after previously testing the yearly highs. There are several inflection points at this support zone so a bounce could be due, and technical indicators are suggesting that buyers are about to return. Technical Indicators Signals. The 100 SMA is....
Bitcoin price is resuming its climb after testing the bottom of the ascending channel visible on the 1-hour chart. Bitcoin Price Key Highlights. Bitcoin price continues to trend higher on its 1-hour time frame, moving on a sharper ascending channel than before. Price just bounced off the channel support and seems to be setting its sights on the resistance around $740-750. Technical indicators are suggesting that further gains are in the cards. Technical Indicators Signals. The 100 SMA is safely above the longer-term 200 SMA on this time frame, confirming that the path of least resistance....
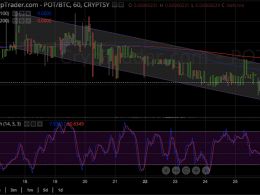
Potcoin Price Key Highlights. Potcoin price has been steadily trending lower, moving inside a descending channel pattern on the 1-hour time frame. Price is testing the latest lows and might be due for a move down to the channel support at 0.00000220BTC or lower. Potcoin price could carry on with its ongoing selloff, as technical indicators also confirm that further losses are likely. Bounce Off Channel Support? Potcoin price might still be able to take a break from its dive if the bottom of the descending channel holds as short-term support. In that case, price could head back up to the....


