
Ethereum Price Technical Analysis for 17/11/2015 - Bulls Waiting to Charge
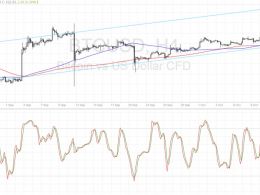
Ethereum Price Key Highlights. Ethereum price retreated from its recent rally upon hitting a high of 0.00294 but might be ready to resume its climb soon. Price has pulled back to the moving averages, which might hold as dynamic support areas, and could gather more bullish momentum. Ethereum price is taking a break from its uptrend but might be due to head north again, if the near-term inflection points hold as support. Correction Over? Technical indicators seem to be suggesting that the ethereum price correction is already over, as stochastic made it out of the oversold region and is....
Related News

Ethereum price seems to have its sights set higher after breaking out of a descending triangle on its 4-hour chart. Technical indicators are also supporting further gains. Ethereum price had previously consolidated inside a descending triangle pattern, forming lower highs and finding support at 0.00250. At the moment, ethereum price is testing the near-term resistance at the 0.00300 level, waiting for more bulls for another leg higher. An upside break past this level could take it up to the next area of interest at 0.00330-0.00350 then onwards to the larger triangle highs at 0.00400.

Bitcoin has crossed the crucial resistance mentioned in A Breakout Everybody's Waiting For!, rising roughly 1.54% to trade at $235.75. The price appreciation has also led to overbought valuation for Bitcoin which might face stiff resistance from the next supply region at around $238. So, should you be buying Bitcoin now or not? Let's find out in the technical analysis below! Technical analysis of the above presented 240-minute BTC/USD price chart indicates that bulls have complete control over the situation and that Bitcoin is a pure buy-on-dips play. Bitcoin Chart Structure - After....

Bitcoin price could be ready to resume its climb now that this area of interest held as support. Bitcoin Price Technical Analysis. Bitcoin price recently made an upside breakout from a near-term resistance around $660. Price has found resistance at the $670 area and has since pulled back to the broken resistance, which appears to have held as support. This signals that bitcoin bulls could be ready to charge once more, although technical indicators are suggesting otherwise. Technical Indicators Signals. The 100 SMA is still below the longer-term 200 SMA so the path of least resistance is to....
Bitcoin price could make another move towards the top of its channel since bulls have been waiting to charge at this area of interest. Bitcoin Price Key Highlights. Bitcoin price continues to trend higher on its 4-hour time frame, still moving inside its ascending channel pattern. As shown in an earlier article, bitcoin has found support at a former resistance level and looks ready to resume its rally. This area of interest is right in the middle of its longer-term ascending channel. Technical Indicators Signals. The 100 SMA is above the longer-term 200 SMA on this time frame, which means....

Ethereum Price Key Highlights. Ethereum price appears to be creating a range on its 1-hour time frame, unable to sustain its momentum after an earlier breakout. Price found resistance at 0.00300 and support at the 0.00285 area. Ethereum price just bounced off the top of its range and may be ready to test the bottom once more. Ethereum price could continue with its sideways movement, as technical indicators aren't offering any signals for directional plays. Short-Term Profit Opportunities. With that, ethereum traders might simply go for short-term gains, buying off support and selling at....