Bitcoin Price Technical Analysis for 30/11/2015 - Bulls Gaining Traction
e bullsBitcoin Price Key Highlights. Following an upside break from its triangle consolidation pattern last week, bitcoin price made a sustained climb to an area of interest. A bullish flag pattern formed right on the support-turned-resistance area and now bitcoin price has broken through that ceiling again. Bitcoin price could be eyeing more gains from here, as the upside flag breakout reflected stronger bullish momentum. Where to Next? Bitcoin price might have its sights set on this month's highs near the $500 mark, as the average directional index is showing trending market conditions.....
Related News
Litecoin price has jumped 3.35 percent to $3.980 after retesting the downward sloping support line. In the previous Litecoin price technical analysis Cautiously Optimistic, I had revised the support level to $3.720 and suggested that a weakening Bitcoin could add more pressure on the Litecoin bulls. As Bitcoin came down with a thud, Litecoin also tumbled to a low of $3.764 before gaining positive momentum. Short covering may have also helped the bulls' cause. Technically, Litecoin is still on a slippery slope but rising after retesting the support should give confidence to the buyers. Take....
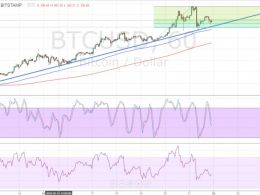
Bitcoin price is once again testing the rising trend line support and might be due for another bounce to its previous highs and beyond. Bitcoin price already bounced off the 61.8% Fibonacci retracement level at $428.58 and appears ready to climb to the swing high at $447.94. However, buyers still seem hesitant and are still waiting for more bulls to join the fold. For now, price is stalling at the 50% Fib at $432.15 and might need another quick test of the trend line, which lines up with the 100 SMA. Speaking of the moving averages, the short-term 100 SMA is still above the longer-term 200....
I will resume writing a daily LTC price technical analysis starting from today, so throughout this article, I will try establishing some key resistance and support points that would help us read through the charts and detect clues that can predict future price movements. Last week, LTC price surged to exceed $4 on the 31st of October. The bullish wave started a day earlier than Bitcoin's surge and Litecoin's price rose from $3 to around $3.72 last Sunday. However, as Bitcoin's price rose above the $340 resistance level, LTC also continues to print higher highs. Bulls in Control On 1 Day....
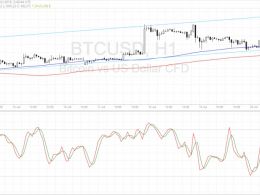
Bitcoin price made a downside break from its ascending channel pattern, signaling that a reversal is about to take place. Bitcoin Price Key Highlights. Bitcoin price was previously trading inside an ascending channel before making a break lower, indicating a reversal from the short-term uptrend. Price also broke below the nearby inflection points, which means that sellers are gaining traction. For now, technical indicators are suggesting that the uptrend might still carry on but that could change soon. Technical Indicators Signals. The 100 SMA is still above the longer-term 200 SMA so the....
All hell has broken loose in the Bitcoin market! The price of Bitcoin crashed more than 13 percent intraday after bears crushed the bulls following the Bitcoin XT controversy. As of now, short covering has helped lift the price up to $235.66, still off more than 7 percent. With this, all the hard work done by the bulls since June has been undone. In the previous Bitcoin price technical analysis, The Pressure is Simply Too Much, I had clearly stated that if the selling pressure were to increase even slightly, it would lead to a breakdown kind of situation in the cryptocurrency. My short....


