Dogecoin Price Technical Analysis - False Spike and Reversal?
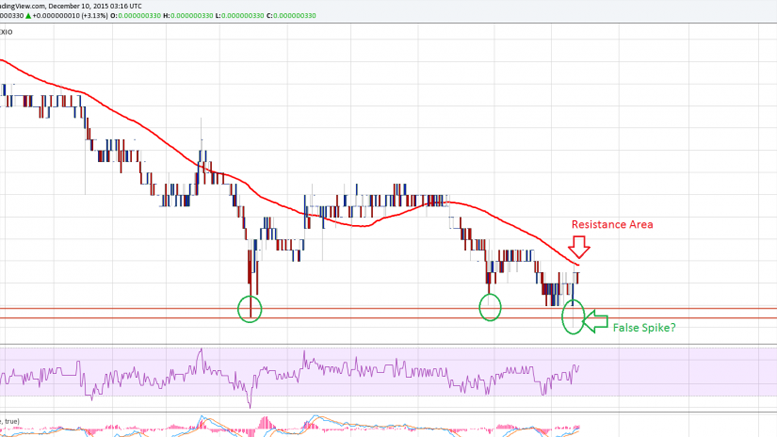
Key Highlights. Dogecoin prices spiked below an important support area of 28 satoshis, but later managed to move back higher. The price is caught in a range of 28-33 satoshis, and waiting for a catalyst for the next move. As pointed out in yesterday's post, there is a possibility of a triple bottom pattern looking at the price feed from IO. Dogecoin's price is stuck in a range, and that's why conservative traders can wait for a break-either upwards or downwards-before placing an order. 32-33 as Resistance Area. Dogecoin prices fell below a major support area of 28 satoshis intraday, but....
Related News

Key Highlights. Dogecoin price spiked down and tested the swing low of 26.5 Satoshis where buyers defended the downside. This can be seen as a false break or may be a quick move down with the data feed from HitBTC. The price is still above a major support trend line on the 30-min chart, suggesting that short-term trend is still bullish. Dogecoin price after the recent false spike may trade back higher. If there is a close above 32.0 Satoshis, then buyers may take control. Buy close to the trend line and support area? Dogecoin price fell sharply Intraday, and broke a major support trend....

Dogecoin’s price is entering a new bullish phase after months of decline. Technical analysis of the daily candlestick timeframe chart shows that the popular meme cryptocurrency is flashing a trend reversal, hinting at a significant shift from bearish to bullish momentum. Analyst Flags Daily Trend Reversal On Dogecoin Chart A prominent crypto analyst known as Trader Tardigrade has highlighted a confirmed trend reversal for Dogecoin. In a post on X (formerly Twitter) this week, he pointed out that DOGE’s daily chart has flipped from a downtrend to an uptrend. This claim is reinforced....

Dogecoin has witnessed a massive spike in its active addresses, providing a bullish outlook for the foremost meme coin. Based on this development, the DOGE price could also witness a bullish reversal soon enough as it reclaims key support levels. Dogecoin Records 47% Spike In Active Addresses In an X post, crypto analyst Ali Martinez […]

Key Highlights. The Dogecoin price is finding it hard to get a reason for a move higher, as it remained under the bearish pressure. There is a bearish trend line formed on the 30-mins chart (price feed from CEX. IO), suggesting a downside move. There is a possible false spike higher noted on the hourly chart of the price feed provided by HitBTC. Dogecoin price remains at a risk of further losses, and slowly all possible bullish signs start to diminish with sellers stepping in. Trend Line as Resistance. There is a bearish trend line forming on the 30-mins chart of the Dogecoin price (data....
Key Highlights. Dogecoin price broke an important triangle as forecasted in Yesterday's analysis. Downside momentum was limited, which creates a risk of a false break. 0 Satoshis is an immediate support, which must hold if the recent break is a false one. Dogecoin sellers cleared a critical support, but failed to gain pace, which is a worrying sign in the near term. Downside Continuation Likely. We highlighted atriangle pattern on the hourly chart of Dogecoin Yesterday, which was breached later during the day as forecasted. However, the break was not convincing, as there was no follow....