
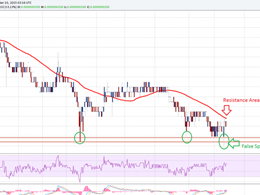
Dogecoin Price Technical Analysis For 22/12/2015 - False Break and Higher?
Key Highlights. Dogecoin price spiked down and tested the swing low of 26.5 Satoshis where buyers defended the downside. This can be seen as a false break or may be a quick move down with the data feed from HitBTC. The price is still above a major support trend line on the 30-min chart, suggesting that short-term trend is still bullish. Dogecoin price after the recent false spike may trade back higher. If there is a close above 32.0 Satoshis, then buyers may take control. Buy close to the trend line and support area? Dogecoin price fell sharply Intraday, and broke a major support trend....
Related News

Dogecoin Price Key Highlights. Dogecoin price dived lower, and the recent trend line break turned out to be a false one. The price moved below the last low to create a new low around 52.6 Satoshis. 100 hourly simple moving average is acting as a monster resistance, as buyers failed to break it. Dogecoin price moved lower below the last low to open the doors for more losses in the near term may be towards 50.0 Satoshis. Move towards 50.0 Satoshis? We highlighted recently that there might be a false break on the hourly chart of Dogecoin, as there was a trend line break but it was not....
Key Highlights. Dogecoin price broke an important triangle as forecasted in Yesterday's analysis. Downside momentum was limited, which creates a risk of a false break. 0 Satoshis is an immediate support, which must hold if the recent break is a false one. Dogecoin sellers cleared a critical support, but failed to gain pace, which is a worrying sign in the near term. Downside Continuation Likely. We highlighted atriangle pattern on the hourly chart of Dogecoin Yesterday, which was breached later during the day as forecasted. However, the break was not convincing, as there was no follow....

Key Highlights. Dogecoin price looks like it's on the verge of a short-term break as can be seen on the 30-mins chart (price feed from CEX. IO). There is a nice channel pattern formed on the 4-hours chart (price feed from HitBTC), suggesting a caution for sellers moving ahead. The price is above the 100 simple moving average (SMA) - H4, which is a positive sign for the bulls in the near term. Dogecoin price may trade higher if buyers take control, as looking at the higher timeframe chart (H4), there are many bullish signs. 100 SMA as Catalyst. Dogecoin price failed to gain traction....
Dogecoin Price Key Highlights. Dogecoin price finally spiked higher and traded above a major bearish trend line. The trend line break was not convincing, and it might be the case that it could be a false one. The price is trading around 100 hourly simple moving average, and if there is a satisfactory close above it more gains are likely. Dogecoin price spiking above the bearish trend line was a good sign, but it might still trade in a range moving ahead. Range Persists? The Dogecoin price after trading for a long time inside a tiny range and below a major bearish trend line managed to....
Key Highlights. Dogecoin prices spiked below an important support area of 28 satoshis, but later managed to move back higher. The price is caught in a range of 28-33 satoshis, and waiting for a catalyst for the next move. As pointed out in yesterday's post, there is a possibility of a triple bottom pattern looking at the price feed from IO. Dogecoin's price is stuck in a range, and that's why conservative traders can wait for a break-either upwards or downwards-before placing an order. 32-33 as Resistance Area. Dogecoin prices fell below a major support area of 28 satoshis intraday, but....