Litecoin Price Technical Analysis - Continues to Probe Bearish Trend Line
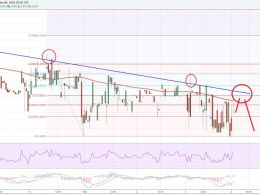
Key Highlights. Litecoin's price is struggling to gain momentum, and continued to probe an important bearish trend line on the hourly chart (data feed from Bitfinex). Only a break above the highlighted trend line and resistance area could ignite an upside move. On the positive side, there is a bullish trend line formed on the 2-hour chart (data feed from HitBTC), acting as a support. Litecoin's price is showing bearish signs if we look at the lower time frame chart, but it is bullish if we look at the 2-hour chart. Buy with a Break? Litecoin's price looks like it's struggling to gain....
Related News
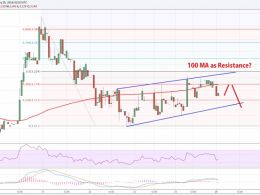
Litecoin price is struggling to settle above the 100 hourly MA. It looks like there might be a short-term dip before it find buyers once again. Intraday Support Level (Bitfinex) may be at $3.10. Intraday Resistance Level (Bitfinex) can be at $3.20. There were a few positive signs for Litecoin price this past week, as it managed to move higher after trading as low as $3.01. The price has now formed an ascending channel pattern formed on the hourly chart (data feed via Bitfinex), which is acting as a mover for the price. However, the price is struggling to break the channel resistance trend....
Litecoin price failed to trade higher. Our sell idea on the 30-min chart was a perfect deal as the price moved down towards $3.00. A Support Level (HitBTC) can be at $3.03. An important Resistance Level (HitBTC) may be $3.18. There were a few bearish signs noted on the 30-mins chart (data feed via Bitfinex) for Litecoin price, which played well and pushed the price down. There was a bullish trend line, which was broken to ignite a bear rally. Now, there is a bearish trend line formed on the same chart that acted as a barrier for buyers on many occasions, and it looks like there is a chance....
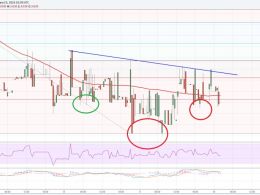
Litecoin price if stays positive may trade higher. There is an inverse head and shoulders pattern in making that can ignite an upside rally. Support Level (HitBTC) is at $3.08. Resistance Level (HitBTC) may be $3.18. Litecoin price is showing a few positive signs on the lower as well as on the higher time frame charts. The price yesterday attempted on a couple of occasions to clear a bearish trend line formed on the 30-min chart (data feed via Bitfinex), and buyers finally succeeded in taking the price higher. The price cleared yesterday’s bearish trend line, but there is now another....
Litecoin Price Key Highlights. Litecoin price previously broke below a rising trend line support, indicating that a reversal from the recent climb is underway and that further losses are likely. Price showed follow-through with its bearish move, although a retracement to the broken support zone might still be possible later on. Litecoin price is still being dragged lower by sellers, as the selloff hasn't looked back since its breakdown from the rising trend line on the 4-hour time frame. Technical signals show exhaustion. The selloff might be losing steam, as technical indicators like....
Key Highlights. Litecoin price failed to move lower and looks like setting up for a downside move. There is a bearish trend line on the 2-hours chart (price feed from Bitfinex), i.e. acting as a catalyst for the downside move. The price settled below the 100 simple moving average (2-hours), which is a bearish signal in the short term. Litecoin price is in a bearish trend as there is a massive resistance around $3.20-30, which is resulting in a downside reaction. Retest of Lows? We stated time and again that there is a major resistance forming around $3.20-30 in Litecoin price. It looks....

