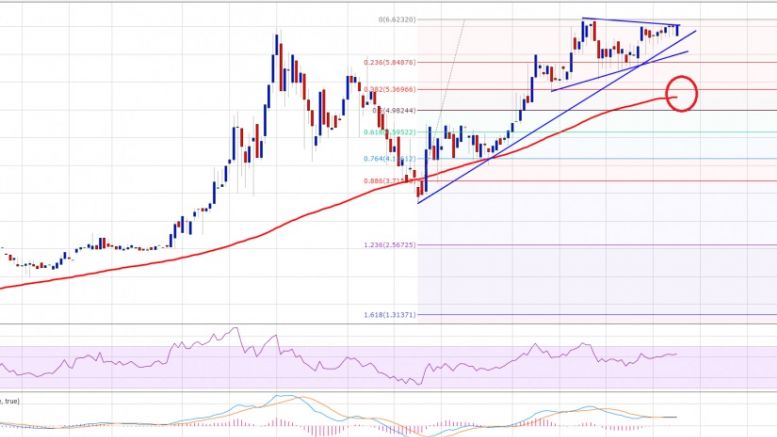
Ethereum Price Technical Analysis – Major Break Looming
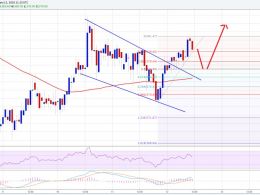
Ethereum price traded higher during the past couple of days. However, it is now trading near a major breakout zone at $6.60-65. Intraday Support Level can be $5.80. Intraday Resistance Level may be $6.65. Ethereum price after correcting lower traded back higher this past week, and currently trading near the last swing high of $6.60-65. It represents a major resistance area, and acted as a barrier for buyers on many times. A contracting triangle pattern is forming on the 4-hours chart (data feed via Kraken), which can be seen as a formation for the next move. A break above the $6.65 level....
Related News
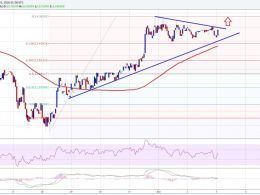
Ethereum price after a minor dip vs the US dollar moved higher. ETH looks like poised for yet another run towards the $14.50 level. Key Highlights. Ethereum price continued to stay in the bullish zone vs the US Dollar, and may be setting up for the next break. Yesterday’s highlighted bullish trend line on the hourly chart (data feed via Kraken) of ETH/USD acted as a support and held the downside move as forecasted. There is now a minor bearish trend line formed on the same chart, which might provide us the next break in ETH/USD. Ethereum Price – Trend Line Break. Ethereum price ETH managed....

After analysis had been posted, yesterday, bitcoin trading bought price up in a surge above resistance. Although more upside may be in store there is another upside technical hurdle looming on the horizon. This analysis is provided by xbt.social with a 3 hour delay. Read the full analysis here. Not a member? Join now and receive a $29 discount using the code CCN29. Bitcoin Trading and Price Analysis. Time of analysis: 15h03 UTC. BTC-China 1-Day Chart. From the analysis pages of xbt.social, earlier today: The 1-day chart shows that yesterday's volatile move was technically justified: MACD....
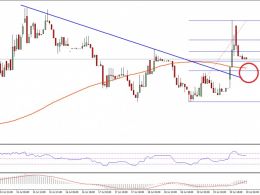
Ethereum price traded higher intraday, and looking at the current technical indicators it looks like it may trade further higher. Key Highlights. Ethereum price managed to move higher against the US Dollar and broke a major resistance area. Yesterday’s highlighted bearish trend line on the hourly chart (data feed via Kraken) of ETH/USD was broken during the recent upside ride. The price is now above the 100 hourly simple moving average, which is a positive sign for the bulls. Ethereum Price Buy. Ethereum price ETH surged higher against the US Dollar and posted a critical break intraday (as....
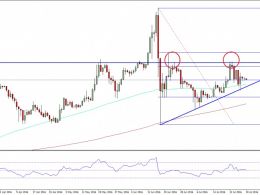
Ethereum price is trading under a major resistance area against the US Dollar, but at the same time remained above a crucial support. Key Highlights. Ethereum price failed miserably around the $15.00 resistance against the US Dollar, and traded lower. The ETH/USD pair had a losing streak this past week, as it failed to gain momentum. There is likely a double top pattern forming on the daily chart of the ETH/USD pair, which may produce a decline in the short term. Ethereum Price Trend. Ethereum price ETH failed to trade higher this past week against the US Dollar. There was a major hurdle....
Bitcoin price is showing bullish signs on the lower time frame chart, but the daily chart is pointing towards a crucial break in the near term. Intraday Support Level can be at $374. Intraday Resistance Level may be $380. Bitcoin price remained under a lot of bearish pressure this week, as there was a monster resistance on the daily chart formed. The price continuously found sellers near the 100-day simple moving average (daily chart and data feed from HitBTC). It looks like a solid bearish structure formed on the daily chart, and if sellers gain control, then the price may head lower in....