Bitcoin Price Technical Analysis – Major Break Looming?
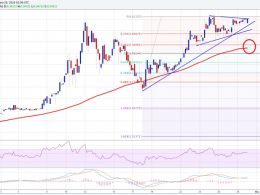
Bitcoin price is showing bullish signs on the lower time frame chart, but the daily chart is pointing towards a crucial break in the near term. Intraday Support Level can be at $374. Intraday Resistance Level may be $380. Bitcoin price remained under a lot of bearish pressure this week, as there was a monster resistance on the daily chart formed. The price continuously found sellers near the 100-day simple moving average (daily chart and data feed from HitBTC). It looks like a solid bearish structure formed on the daily chart, and if sellers gain control, then the price may head lower in....
Related News

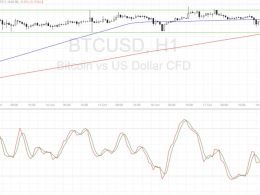
After analysis had been posted, yesterday, bitcoin trading bought price up in a surge above resistance. Although more upside may be in store there is another upside technical hurdle looming on the horizon. This analysis is provided by xbt.social with a 3 hour delay. Read the full analysis here. Not a member? Join now and receive a $29 discount using the code CCN29. Bitcoin Trading and Price Analysis. Time of analysis: 15h03 UTC. BTC-China 1-Day Chart. From the analysis pages of xbt.social, earlier today: The 1-day chart shows that yesterday's volatile move was technically justified: MACD....
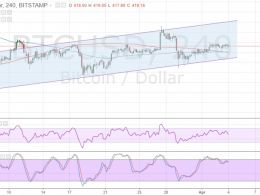
Ethereum price traded higher during the past couple of days. However, it is now trading near a major breakout zone at $6.60-65. Intraday Support Level can be $5.80. Intraday Resistance Level may be $6.65. Ethereum price after correcting lower traded back higher this past week, and currently trading near the last swing high of $6.60-65. It represents a major resistance area, and acted as a barrier for buyers on many times. A contracting triangle pattern is forming on the 4-hours chart (data feed via Kraken), which can be seen as a formation for the next move. A break above the $6.65 level....
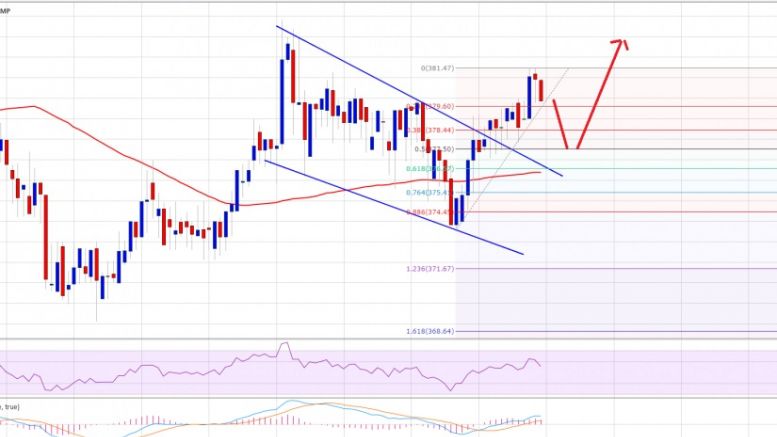
Bitcoin price could continue to consolidate but if a breakout occurs, technicals are favoring a downside move. Bitcoin Price Key Highlights. Bitcoin price is still stuck in its tight range on the short-term time frames, bouncing off support once more. A test of the near-term resistance could be in the cards but technical signals are pointing to a downside break. Buyers seem to be running out of momentum or traders are simply waiting for fresh market catalysts. Technical Indicators Signals. The 100 SMA is above the longer-term 200 SMA for now, which suggests that buyers still may have a bit....
Bitcoin price is slowly crawling higher with the rising channel still intact, but a downside break and reversal might be looming. The 100 SMA is below the 200 SMA for now so the path of least resistance might be to the downside. However, an upward crossover appears to be taking place to show a pickup in bullish strength. If so, bitcoin price could make a stronger attempt to rally towards the channel resistance. Stochastic is making its way down from the overbought level to show a return in bearish pressure. RSI is also heading south so bitcoin price might follow suit. In that case, price....

Dogecoin Price Key Highlights. Dogecoin price continued to trade below 50.0 Satoshis, as there was not break either higher or lower. The price is still trading below the 50 level, which is a bearish sign and could take it lower. There is a breakout pattern forming on the hourly chart in the form of a channel that might act as a catalyst moving ahead. Dogecoin price struggling to gain momentum, which increases the risk of it moving lower in the near term. More losses ahead? There was no break yesterday in the Dogecoin price, and both buyers and sellers failed to gain momentum. The price was....