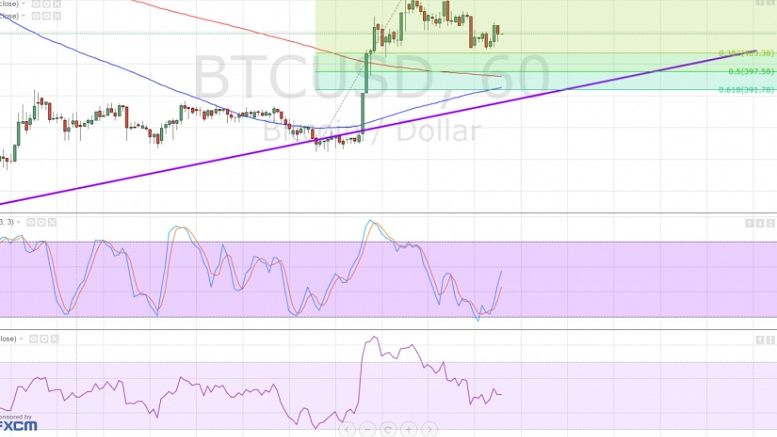
Bitcoin Price Technical Analysis for 22/01/2016 – Bulls Revving Up?
Bitcoin price could be starting a new uptrend but it needs to find support at the nearby Fib levels before confirming this climb. Risk-on flows appear to be supporting the cryptocurrency and weighing on dollar demand. Bitcoin price appears to be starting a new trend on its short-term time frames, as an ascending trend line can be drawn to connect the recent lows of price action. Technical indicators are also hinting at a start of a short-term uptrend, with the moving averages looking prime for an upward crossover. Using the Fibonacci retracement tool on the latest swing high and low....
Related News

Bitcoin Price Key Highlights. Bitcoin price has been in good spirits these days, as it has taken out one resistance level after another. Price made a quick short-term retracement before revving up for another ride north, setting its sights on the rising channel resistance. Increased bullish momentum could keep bitcoin price climbing, possibly until the top of the rising channel on the daily time frame. Aiming for $350? Now that price has broken past the significant $300 barrier, bitcoin could head all the way up to the next resistance at the $350 level, which is right in line with the....
Bitcoin price has exhibited strong bearish momentum but is in the middle of a retracement from its sharp downside move. Bitcoin Price Key Highlights. Bitcoin price made a strong bounce after its sharp drop, reflecting a correction for sellers. Price could pull up to the broken consolidation support or to the moving averages before resuming its drop. The recent hack on a bitcoin exchange in Hong Kong has put downside pressure on prices. Technical Indicators Signals. The 100 SMA is below the longer-term 200 SMA, signifying that the path of least resistance is to the downside and that further....

Bitcoin price could be ready to resume its climb now that this area of interest held as support. Bitcoin Price Technical Analysis. Bitcoin price recently made an upside breakout from a near-term resistance around $660. Price has found resistance at the $670 area and has since pulled back to the broken resistance, which appears to have held as support. This signals that bitcoin bulls could be ready to charge once more, although technical indicators are suggesting otherwise. Technical Indicators Signals. The 100 SMA is still below the longer-term 200 SMA so the path of least resistance is to....
Bitcoin price is retreating upon reaching its yearly highs but bulls could be ready for another push higher after this pullback. Bitcoin Price Key Highlights. Bitcoin price reached the yearly highs around $780 and profit-taking happened as predicted in the previous article. Price is now making a pullback from its recent rally and could encounter more bulls who are waiting at the next area of interest. Technical indicators are confirming that the uptrend could resume once the correction is completed. Technical Indicators Signals. The 100 SMA just crossed above the longer-term 200 SMA to....

Ethereum price seems to have its sights set higher after breaking out of a descending triangle on its 4-hour chart. Technical indicators are also supporting further gains. Ethereum price had previously consolidated inside a descending triangle pattern, forming lower highs and finding support at 0.00250. At the moment, ethereum price is testing the near-term resistance at the 0.00300 level, waiting for more bulls for another leg higher. An upside break past this level could take it up to the next area of interest at 0.00330-0.00350 then onwards to the larger triangle highs at 0.00400.