Bitcoin Price Technical Analysis for 03/08/2016 – Short-Term Downtrend Brewing
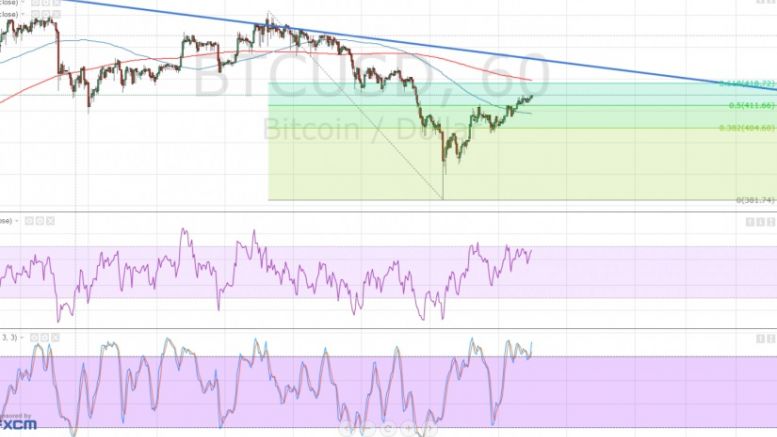
Bitcoin price could be due for another steady drop if the trend line and Fibonacci retracement levels hold as resistance. Applying the Fibonacci retracement tool on the latest swing high and low shows these resistance levels: 50% Fib at $411.66 and 61.8% Fib at $418.72, which is close to the trend line at $420. In addition, the 200 SMA could hold as a dynamic inflection point, keeping gains in check and allowing the selloff to resume as this lines up with an area of interest or former short-term support zone.
Related News

Ethereum Price Key Highlights. After forming a head and shoulders pattern indicated in yesterday's technical analysis article, ethereum price broke below the neckline and confirmed the potential selloff. Price also broke below the rising trend line support, adding to the downtrend signals on the 1-hour time frame. Ethereum price could have its sights set on the next visible floor around 0.0200, although a pullback to the broken neckline and trend line support might be seen. Resistance at 61.8% Fib? The 61.8% Fibonacci retracement level is closest to the broken rising trend line and is also....
After a sharp spike off a support level, litecoin price is still exhibiting a steady downtrend and is testing the moving average on its 1-hour time frame from Bitfinex. If the short-term MA (red) continues to hold, price could retest its former lows and perhaps make new ones. Technical indicators on the same time frame confirm that the cryptocurrency is set to weaken in the short term. The shorter-term EMA (red) is moving below the longer-term EMA (green), confirming the presence of bearish pressure. In addition, the moving averages are edging further apart, which means that the selling....
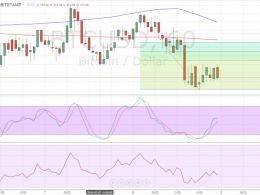
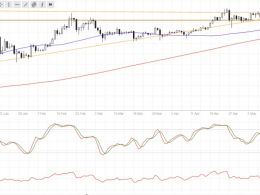
Bitcoin price showed bearish momentum but sellers might need to make a correction before taking it lower. Technical indicators are giving mixed signals for now. Using the Fib tool on the latest breakout move shows that the 38.2% correction level lines up with a broken short-term support around $373. the 61.8% Fib is close to the 200 SMA, which typically acts as a dynamic resistance level. However, the 100 SMA is still above the 200 SMA so the path of least resistance might be to the upside and bitcoin price could go for another round of gains. A downward crossover appears to be brewing....
Bitcoin price could continue to drop after completing a correction to the area of interest at $580. Bitcoin Price Key Highlights. Bitcoin price is still trending lower on its short-term charts, following a break below consolidation and reversal formations. Price could pull up to the descending trend line on the 1-hour chart before resuming its slide, giving sellers an opportunity to catch the downtrend at a better price. Technical indicators are confirming that a downtrend could be in the works. Technical Indicators Signals. The 100 SMA is making a downward crossover from the 200 SMA to....
Bitcoin price made a downside break from the long-term consolidation pattern, signaling that a selloff is about to take place. Bitcoin Price Key Highlights. Bitcoin price has formed higher lows and lower highs, creating a symmetrical triangle consolidation pattern on its daily and 4-hour time frames. Price seems to have finally made a break below the triangle support, indicating that bears have taken control. If so, bitcoin could be due for a prolonged drop, possibly until the triangle bottoms at $350. Technical Indicators Signals. The 100 SMA is still above the 200 SMA on the daily time....