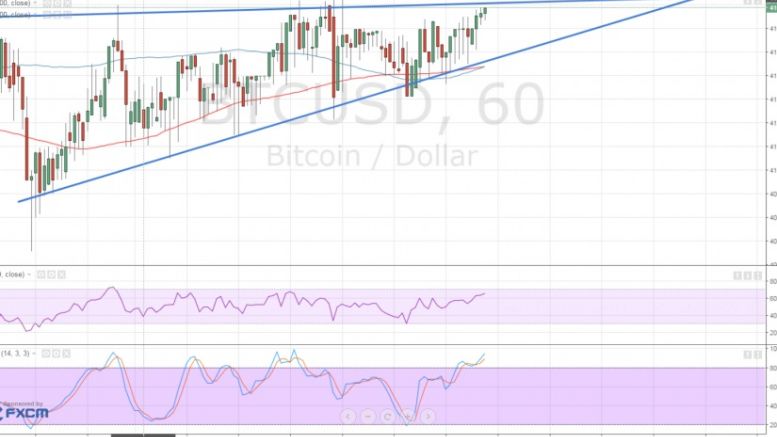
Bitcoin Price Technical Analysis for 03/17/2016 – Bulls Pressing On!
Bitcoin price is trading inside a rising wedge formation, with bulls trying to push for more gains. RSI is on the move up, which means that buyers are in control of bitcoin price action at the moment. However, price is nearing the top of the wedge, which might hold as resistance and lead to a bounce back to the wedge support near $415. Also, RSI is near the overbought zone. Stochastic is in the overbought level already, signaling that buyers might need to take it easy from here and allow sellers to take over. If so, resistance around $418 could hold and lead to a test of support, which is....
Related News
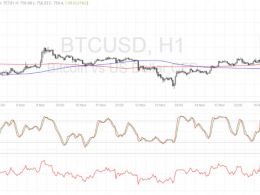
Bitcoin price could be ready to resume its climb now that this area of interest held as support. Bitcoin Price Technical Analysis. Bitcoin price recently made an upside breakout from a near-term resistance around $660. Price has found resistance at the $670 area and has since pulled back to the broken resistance, which appears to have held as support. This signals that bitcoin bulls could be ready to charge once more, although technical indicators are suggesting otherwise. Technical Indicators Signals. The 100 SMA is still below the longer-term 200 SMA so the path of least resistance is to....
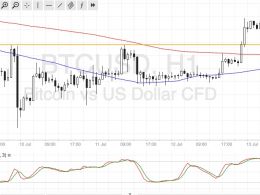
Bitcoin price is retreating upon reaching its yearly highs but bulls could be ready for another push higher after this pullback. Bitcoin Price Key Highlights. Bitcoin price reached the yearly highs around $780 and profit-taking happened as predicted in the previous article. Price is now making a pullback from its recent rally and could encounter more bulls who are waiting at the next area of interest. Technical indicators are confirming that the uptrend could resume once the correction is completed. Technical Indicators Signals. The 100 SMA just crossed above the longer-term 200 SMA to....
Ethereum price seems to have its sights set higher after breaking out of a descending triangle on its 4-hour chart. Technical indicators are also supporting further gains. Ethereum price had previously consolidated inside a descending triangle pattern, forming lower highs and finding support at 0.00250. At the moment, ethereum price is testing the near-term resistance at the 0.00300 level, waiting for more bulls for another leg higher. An upside break past this level could take it up to the next area of interest at 0.00330-0.00350 then onwards to the larger triangle highs at 0.00400.
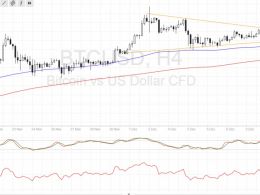
Bitcoin price broke out of its triangle consolidation pattern, indicating that bulls are ready to take control once more. Bitcoin Price Key Highlights. Bitcoin price was previously stuck inside a symmetrical triangle consolidation pattern as bulls and bears were in a tight race. Bulls eventually won out as price made another upside breakout, following the previous break higher on an earlier triangle formation. This puts bitcoin price on track towards testing the $800 handle, which might spur profit-taking once more. Technical Indicators Signals. The 100 SMA is above the longer-term 200 SMA....
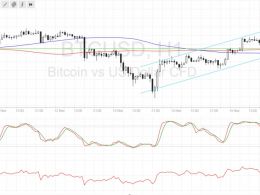
Bitcoin price appears to have chosen to take the northbound route and is waiting for more bulls to sustain the climb. Bitcoin Price Key Highlights. Bitcoin price is establishing a new uptrend, forming an ascending channel visible on its 1-hour chart. In addition, price seems to have broken above the symmetrical consolidation pattern illustrated in an earlier article, signaling further upside. Bitcoin is still testing an area of interest for the time being and technical indicators are giving mixed signals once more. Technical Indicators Signals. The 100 SMA is below the 200 SMA on this time....

