Bitcoin Price Technical Analysis for 11/16/2016 – Bulls Won’t Give Up!
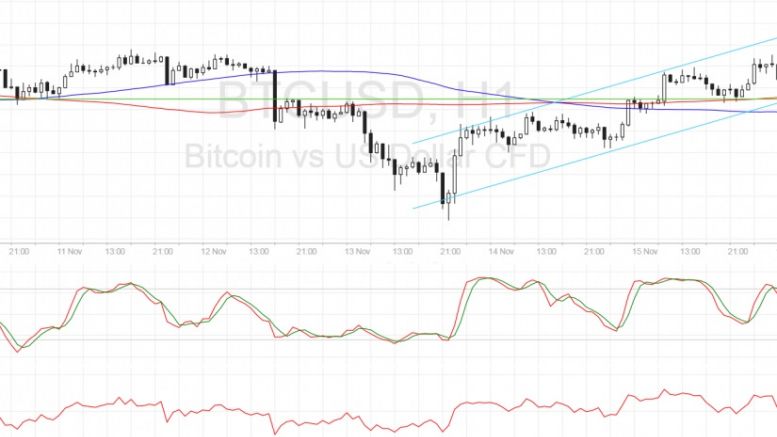
Bitcoin price appears to have chosen to take the northbound route and is waiting for more bulls to sustain the climb. Bitcoin Price Key Highlights. Bitcoin price is establishing a new uptrend, forming an ascending channel visible on its 1-hour chart. In addition, price seems to have broken above the symmetrical consolidation pattern illustrated in an earlier article, signaling further upside. Bitcoin is still testing an area of interest for the time being and technical indicators are giving mixed signals once more. Technical Indicators Signals. The 100 SMA is below the 200 SMA on this time....
Related News
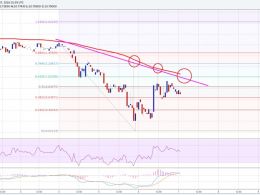
Ethereum price managed to gain a few points, but struggled to break 100 SMA. Can the bulls manage to break it and take ETH/USD higher? Ethereum price ETH showed a few positive signs during the past couple of sessions, but ETH bulls faced a tough time to break a confluence resistance area near $11.00-10. There is a bearish trend line formed on the hourly chart (data feed via Kraken), which is positioned with the 100 hourly simple moving average to form a confluence area. ETH/USD attempted on a couple of times to break the highlighted confluence resistance area, but failed to break the same.....
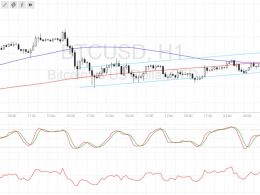
Bitcoin price continues to tread slightly higher as bulls refuse to let up, keeping the cryptocurrency in its short-term uptrend. Bitcoin Price Key Highlights. Bitcoin price is still stuck inside the small ascending channel highlighted in a previous article. Price bounced off support as expected and made a test of the resistance, putting it back on track towards testing the bottom once more. Technical indicators are giving mixed signals at the moment, although traders might be waiting for more market clues. Technical Indicators Signals. The 100 SMA completed its downward crossover from the....
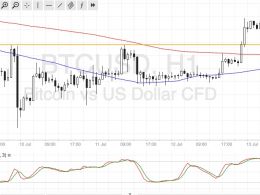
Bitcoin price could be ready to resume its climb now that this area of interest held as support. Bitcoin Price Technical Analysis. Bitcoin price recently made an upside breakout from a near-term resistance around $660. Price has found resistance at the $670 area and has since pulled back to the broken resistance, which appears to have held as support. This signals that bitcoin bulls could be ready to charge once more, although technical indicators are suggesting otherwise. Technical Indicators Signals. The 100 SMA is still below the longer-term 200 SMA so the path of least resistance is to....
Litecoin is facing pressure just like Bitcoin and has been unable to cross the major resistance level of $2.08. However, as mentioned in yesterday's analysis, it has again respected the 20-day simple moving average of $2.019, boosting investors' morale. The “Long” recommendation is based on the technical analysis done on the 240-minute LTC/Dollar price chart. Here are some noteworthy observations: Price Structure - As can be seen from the chart, the price is floating well above the support level of $1.98 and has recently reaffirmed the 20-day SMA of $2.019 as a support. Sustaining above....
Litecoin price has jumped 3.35 percent to $3.980 after retesting the downward sloping support line. In the previous Litecoin price technical analysis Cautiously Optimistic, I had revised the support level to $3.720 and suggested that a weakening Bitcoin could add more pressure on the Litecoin bulls. As Bitcoin came down with a thud, Litecoin also tumbled to a low of $3.764 before gaining positive momentum. Short covering may have also helped the bulls' cause. Technically, Litecoin is still on a slippery slope but rising after retesting the support should give confidence to the buyers. Take....


