Ethereum Price Technical Analysis 04/07/2016 – 100 MA As Resistance
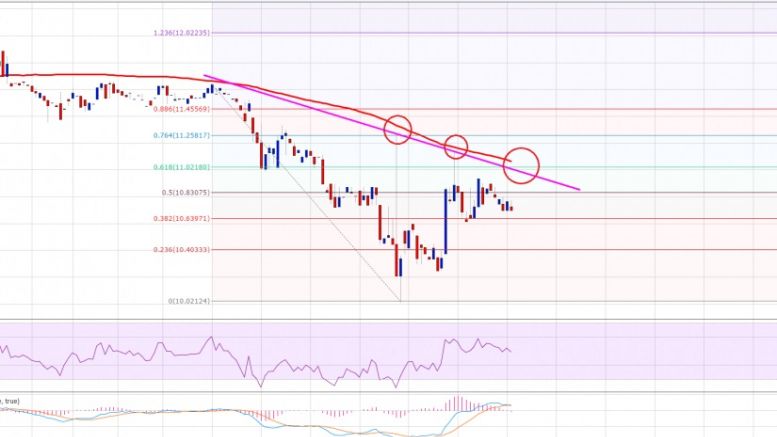
Ethereum price managed to gain a few points, but struggled to break 100 SMA. Can the bulls manage to break it and take ETH/USD higher? Ethereum price ETH showed a few positive signs during the past couple of sessions, but ETH bulls faced a tough time to break a confluence resistance area near $11.00-10. There is a bearish trend line formed on the hourly chart (data feed via Kraken), which is positioned with the 100 hourly simple moving average to form a confluence area. ETH/USD attempted on a couple of times to break the highlighted confluence resistance area, but failed to break the same.....
Related News
Ethereum price popped above a major resistance area of $11.80. Now, can it provide support and push ETH higher versus the USD? Ethereum price kept struggling near the $11.80 resistance area, as highlighted in yesterday’s post. However, the ETH bulls finally managed to take the price above the stated level, and there was an hourly close above it. Now, the price is moving down, and the same resistance area is currently acting as a support and helping the bulls to regain ground. There is an ascending channel pattern formed on the hourly chart (data feed via Kraken) of ETH/USD, which may play....
Bitcoin price pulled back from its recent rally and is finding support at a former resistance level. Bitcoin Price Technical Analysis. Bitcoin price is currently testing an area of interest and might be due for a bounce. The broken resistance around $715 is holding as support for the time being. Technical inflection points are also lining up with this area of interest. Technical Indicators Signals. The 100 SMA just crossed above the longer-term 200 SMA so the path of least resistance is to the upside. In addition these moving averages coincide with the former resistance around $715, adding....
Ethereum price seems to have its sights set higher after breaking out of a descending triangle on its 4-hour chart. Technical indicators are also supporting further gains. Ethereum price had previously consolidated inside a descending triangle pattern, forming lower highs and finding support at 0.00250. At the moment, ethereum price is testing the near-term resistance at the 0.00300 level, waiting for more bulls for another leg higher. An upside break past this level could take it up to the next area of interest at 0.00330-0.00350 then onwards to the larger triangle highs at 0.00400.
Bitcoin price could be ready to resume its climb now that this area of interest held as support. Bitcoin Price Technical Analysis. Bitcoin price recently made an upside breakout from a near-term resistance around $660. Price has found resistance at the $670 area and has since pulled back to the broken resistance, which appears to have held as support. This signals that bitcoin bulls could be ready to charge once more, although technical indicators are suggesting otherwise. Technical Indicators Signals. The 100 SMA is still below the longer-term 200 SMA so the path of least resistance is to....
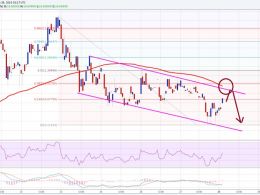
Ethereum price after trading towards $10.00-10 recovered. However, ETH/USD is now below a major resistance area of $11.00 that can be a sell zone. Ethereum price recently struggled to trade with a positive tone, and as a result, there was a downside move taking ETH/USD towards $10.00-10. The price looks like under a bearish pressure, which could result in more losses in the near future. There is a descending channel pattern formed on the hourly chart (data feed via Kraken), which is acting as a catalyst for the price. On the upside, the channel resistance area is coinciding with the 100....

