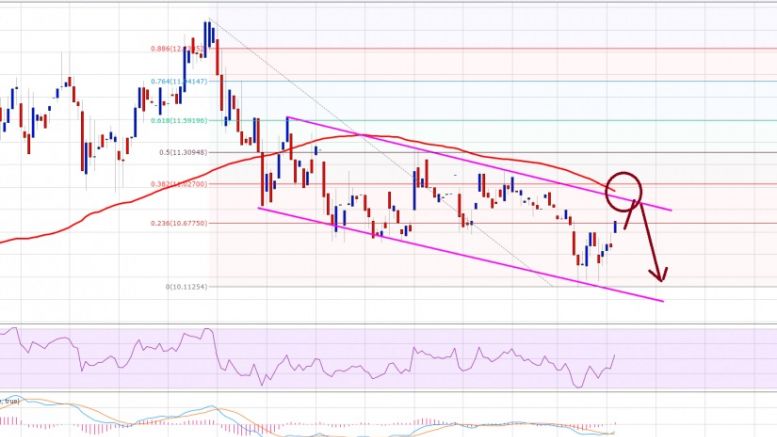
Ethereum Price Technical Analysis 03/28/2016 – Can ETH Break $11.00?
Ethereum price after trading towards $10.00-10 recovered. However, ETH/USD is now below a major resistance area of $11.00 that can be a sell zone. Ethereum price recently struggled to trade with a positive tone, and as a result, there was a downside move taking ETH/USD towards $10.00-10. The price looks like under a bearish pressure, which could result in more losses in the near future. There is a descending channel pattern formed on the hourly chart (data feed via Kraken), which is acting as a catalyst for the price. On the upside, the channel resistance area is coinciding with the 100....
Related News
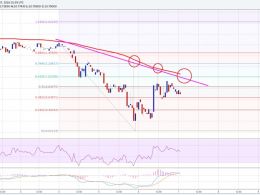
Ethereum price managed to gain a few points, but struggled to break 100 SMA. Can the bulls manage to break it and take ETH/USD higher? Ethereum price ETH showed a few positive signs during the past couple of sessions, but ETH bulls faced a tough time to break a confluence resistance area near $11.00-10. There is a bearish trend line formed on the hourly chart (data feed via Kraken), which is positioned with the 100 hourly simple moving average to form a confluence area. ETH/USD attempted on a couple of times to break the highlighted confluence resistance area, but failed to break the same.....

Ethereum price successfully completed another wave higher. However, the price is struggling to clear $11.80. Can ETH/USD break it or will the price move down? Yesterday, I highlighted that a short term buying dips idea may work well. Ethereum price did move down a few points to provide an opportunity to enter a long, and then ETH moved back higher. However, the bulls failed to break the last high near $11.80, as it acted as a major barrier and prevented any further gains. Currently, the price is attempting to break a bullish trend line formed on the hourly chart (data feed via Kraken) of....

Ethereum price seems to have its sights set higher after breaking out of a descending triangle on its 4-hour chart. Technical indicators are also supporting further gains. Ethereum price had previously consolidated inside a descending triangle pattern, forming lower highs and finding support at 0.00250. At the moment, ethereum price is testing the near-term resistance at the 0.00300 level, waiting for more bulls for another leg higher. An upside break past this level could take it up to the next area of interest at 0.00330-0.00350 then onwards to the larger triangle highs at 0.00400.
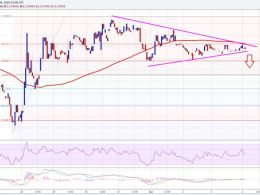
Ethereum price is struggling to trade higher, and approaching a short-term breakout. Can sellers succeed or the bulls will overcome selling pressure? Ethereum price after failing to break the $12.12 level against the US Dollar moved down, and showed a lot of bearish signs lately. The price closed below the 100 hourly simple moving average as well, which suggests that the bulls are struggling to take the price higher. There is a contracting triangle pattern forming on the hourly chart (data feed via Kraken) of ETH/USD, which may be seen as a catalyst for the next move. The highlighted....
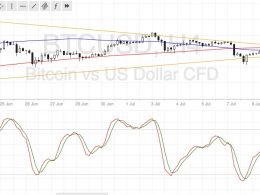
Bitcoin price could be due for a strong break out of its consolidation pattern, but traders still seem to be undecided which way to push. Bitcoin Price Technical Analysis. Bitcoin price is still stuck in its consolidation pattern visible on the 4-hour time frame. Price is already at the peak of the symmetrical triangle formation, which means that a breakout could take place anytime now. Technical indicators and market sentiment appear to be hinting at a downside break. Technical Indicators Signals. The 100 SMA is below the 200 SMA so the path of least resistance is to the downside. A....