Ethereum Price Technical Analysis 03/22/2016 – Bulls Are Back!
Ethereum price moved above a major resistance area intraday. Buying dips may be a good option in the short term as long as it is above $10.50. Intraday Support Level can be $10.50. Intraday Resistance Level may be $12.00. Yesterday, I stated that if Ethereum price manages to close above the 100 simple moving average (hourly, data feed via Kraken), then we can consider a buy trade. The idea worked perfectly, as there was a break and close above the stated MA and there was a nice upside move. The price traded as high as $12.00, where it found sellers and moving ahead may correct a few points....
Related News

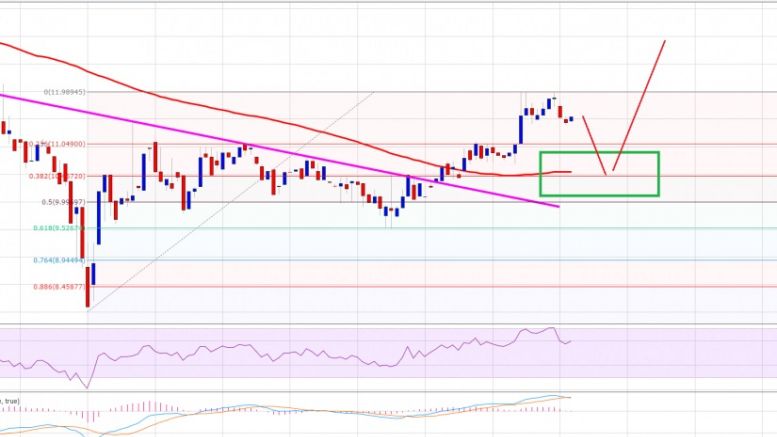
Ethereum price seems to have its sights set higher after breaking out of a descending triangle on its 4-hour chart. Technical indicators are also supporting further gains. Ethereum price had previously consolidated inside a descending triangle pattern, forming lower highs and finding support at 0.00250. At the moment, ethereum price is testing the near-term resistance at the 0.00300 level, waiting for more bulls for another leg higher. An upside break past this level could take it up to the next area of interest at 0.00330-0.00350 then onwards to the larger triangle highs at 0.00400.
Ethereum price traded down finally and also moved back below $10.0. It looks like there is a chance of a minor correction moving ahead. Intraday Support Level can be $9.07. Intraday Resistance Level may be $10.5. Ethereum price as highlighted yesterday made a new high of $11.98 where it found sellers and started to move down. The price also traded below the $10.0 level, which is a sign that bulls stepped back and failed to prevent losses. If the bears manage to gain strength, then there is a chance of more losses in the near term.

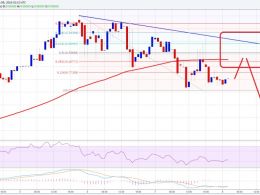
Bitcoin price could be ready to resume its climb now that this area of interest held as support. Bitcoin Price Technical Analysis. Bitcoin price recently made an upside breakout from a near-term resistance around $660. Price has found resistance at the $670 area and has since pulled back to the broken resistance, which appears to have held as support. This signals that bitcoin bulls could be ready to charge once more, although technical indicators are suggesting otherwise. Technical Indicators Signals. The 100 SMA is still below the longer-term 200 SMA so the path of least resistance is to....
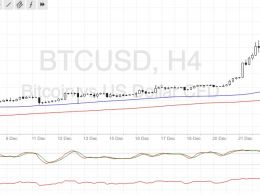
Bitcoin price is bracing itself for a strong finish for the year, as it raked in more gains above $900. Bitcoin Price Key Highlights. Bitcoin price carried on with its climb as expected, after breaking past the $800 barrier a few days back. Price topped near $950 before making a pullback on Christmas Day, which then offered bulls a chance to add to their long positions or draw more buyers in. Price could be on its way to breaking past the recent highs from here. Technical Indicators Signals. The 100 SMA is above the longer-term 200 SMA on the 4-hour time frame of bitcoin, confirming that....
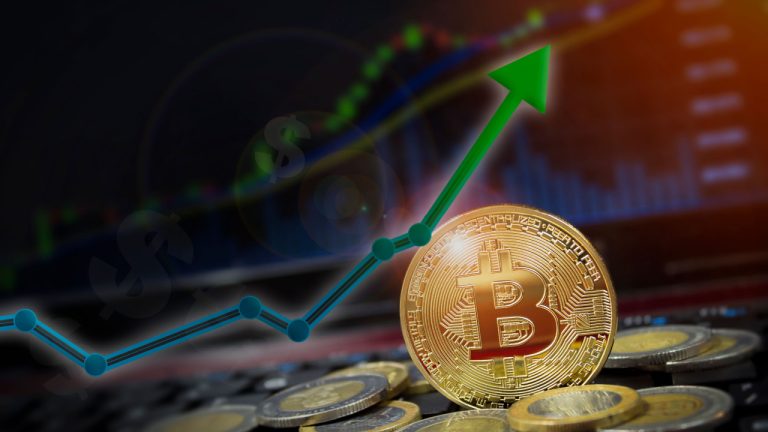
Bitcoin was back above $20,000 on Tuesday, as bulls seemingly moved in to buy following the recent dip in price. The token dropped to a multi-week low over the weekend, however prices have now risen in back-to-back sessions. Ethereum was also in the green, as prices briefly recaptured $1,600. Bitcoin Bitcoin (BTC) was trading higher for a second consecutive session, as the token rallied back above $20,000 following recent declines. BTC/USD dropped to a low of $19,600.79 on Sunday, however after two days of gains, prices reached a peak of $20,542.64 earlier today. This move sees bitcoin....