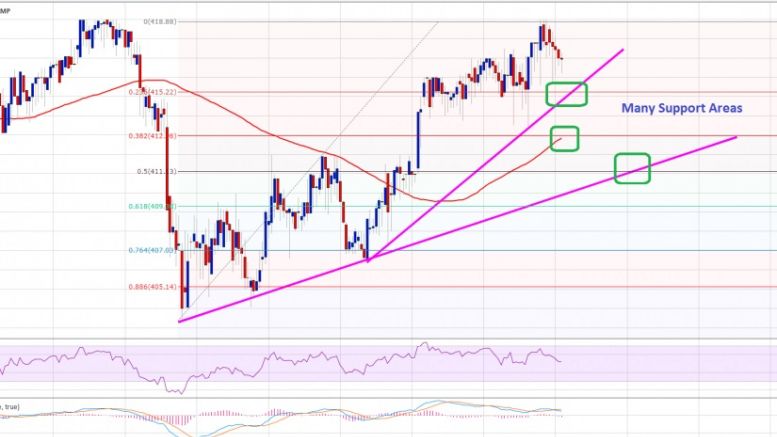
Bitcoin Price Technical Analysis For 03/24/2016 – Beginning of Bullish Trend?
Bitcoin price gained intraday to trade near $418-420. Now, can BTCUSD continue trading higher as there are many supports formed on the downside? Bitcoin price showed a lot of positive signs during the past few hours, and if we look at the short-term view, then BCTUSD was all bullish. However, can we consider it a change in the trend from bearish to bullish? Only time can tell, but looking at the higher timeframe chart, the price is still below a monster resistance area of $420-425. The stated level holds a lot of importance for the next major move in BTCUSD and could ignite a lot of....
Related News
Bitcoin price is pulling up from its slide but might be ready to trend lower upon testing the resistance. Bitcoin Price Key Highlights. Bitcoin price is trading in a downtrend, moving below a descending trend line on its daily time frame. Price is gearing up for a test of the trend line and could be ready to resume the selloff soon. However, technical indicators are suggesting that buying pressure might still be present. Technical Indicators Signals. The 100 SMA is still above the longer-term 200 SMA so the path of least resistance could still be to the upside. In that case, a break past....

Bitcoin price rose to print a high of around $298 yesterday, before declining to around $288, which touches the rising support level we spotted on Wednesday's analysis, earlier today. It seems like we are witnessing a "whiplash" downwards phase that proceeds a forwards phase that will lead to a breakthrough the $300 resistance level. By studying the 1 hour Bitfinex (BTC/USD) chart from tradingview.com and plotting the 20, 50 and 100 period EMAs accordingly (look at the below chart), we can conclude the following: Since the beginning of March's bullish trend, bitcoin price has been....
Bitcoin price could be ready for another bounce off the channel support as the bullish trend goes on. Bitcoin Price Key Highlights. Bitcoin price is still inside that ascending channel on its 1-hour time frame, bouncing off support as suggested in the earlier article. Price just got rejected on its test of the channel resistance once more, putting it back on track towards testing support. Technical indicators are suggesting that a pullback could take place but that the bullish trend could continue. Technical Indicators Signals. The 100 SMA is above the longer-term 200 SMA so the path of....

2016 has been an exciting year for cryptocurrencies. With most of the major open-source currencies showing growth this year and with some expected to see significant expansion in 2017, 2016 reflects a loss of faith in traditional money systems in light of the global populism trend and a growing confidence in the underlying technologies in play for crypto transactions. As the year comes to an end, CoinDesk took a moment to look at the best-performing cryptocurrencies by market capitalization for the year and the factors that affected the markets throughout the year. For the sake of this....
Bitcoin price is enjoying stronger bullish pressure that’s pushing it up on a much steeper climb lately. Bitcoin Price Key Highlights. Bitcoin price has been making one upside breakout after another, indicating the presence of strong bullish momentum. A steeper rising trend line can be drawn to connect the latest lows of price action on the 1-hour time frame. Price could be in for a shallow pullback to this rising trend line or a larger correction to the nearby area of interest. Technical Indicators Signals. The 100 SMA is safely above the longer-term 200 SMA so the path of least....