
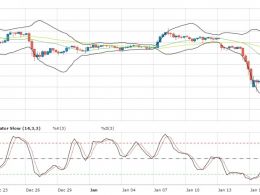
Bitcoin Price Technical Analysis For 03/28/2016 – Looking To Buy BTC?
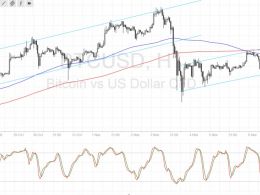
Bitcoin price is showing a lot of positive signs. If the current break in BTC/USD is not false, then more upsides are possible in the short term. Bitcoin price finally managed to pop higher, and the biggest positive was the fact that BTC/USD moved above a major resistance area of $420. Once the price broke the stated level, there was a spike towards $427, which clearly shows how important was the resistance zone. The price is currently correcting and moving down, but the bears have to be careful if they are planning to sell BTC versus the USD. There is a crucial bullish trend line formed....
Related News

Bitcoin remains at the same price level from last week, reinforcing the $600 support area for the entire new cycle. Meanwhile, technical analysis indicates that bullish consensus is getting stronger, increasing the likelihood of a rally from $650 to $820. 5th Elliott Wave forecasting, based on Fibonacci numbers, could be calculated to the technical objective around the $820 area, where several theories point to the delayed next stage. From there, a technical correction should send prices back to $700, giving stragglers a second chance to recalculate their strategies to join. After another....
Bitcoin price seems poised for more declines, putting it on track towards testing a major support zone visible on the longer-term time frames. However, technical signals are looking mixed for now. At the moment, risk appetite appears to be waning once more, as the IMF recently decided to lower their global growth forecasts for 2016 and 2017. The institution highlighted the risks stemming from the slowdown in China and the slump in commodity prices, particularly to emerging economies. With that, the safe-haven US dollar is reigning supreme against most of its counterparts, particularly the....

Bitcoin price could be ready to resume its climb now that this area of interest held as support. Bitcoin Price Technical Analysis. Bitcoin price recently made an upside breakout from a near-term resistance around $660. Price has found resistance at the $670 area and has since pulled back to the broken resistance, which appears to have held as support. This signals that bitcoin bulls could be ready to charge once more, although technical indicators are suggesting otherwise. Technical Indicators Signals. The 100 SMA is still below the longer-term 200 SMA so the path of least resistance is to....
Bitcoin price is stuck in a tighter consolidation pattern, which could set the tone for an even more explosive breakout. Bitcoin Price Technical Analysis. Bitcoin price is starting to form a new ascending channel after its previous breakdown. The consolidation is noticeably tighter these days, which suggests that price could be gearing up for a strong breakout. The US elections would likely have a strong impact on financial market sentiment and dollar price action. Technical Indicators Signals. The 100 SMA just crossed below the longer-term 200 SMA so the path of least resistance is now to....
Bitcoin price found support at the bottom of its ascending channel visible on the 4-hour time frame, but buying pressure seems weak. Bitcoin Price Technical Analysis. Bitcoin price halted its sharp drop yesterday, bouncing off the ascending channel support illustrated in the previous post. Buyers seem to be getting back in the game at that point, possibly yielding another climb back to the resistance at $780. Technical indicators are giving mixed signals for now so a breakdown might still be possible. Technical Indicators Signals. The 100 SMA is above the longer-term 200 SMA so the path of....