Bitcoin Price Technical Analysis for 11/22/2016 – Here Come the Buyers!
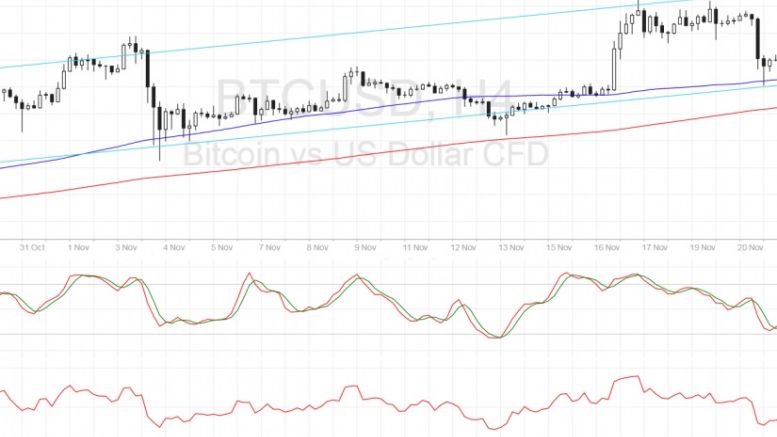
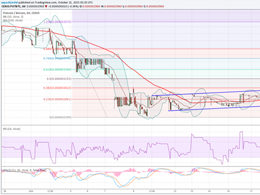
Bitcoin price found support at the bottom of its ascending channel visible on the 4-hour time frame, but buying pressure seems weak. Bitcoin Price Technical Analysis. Bitcoin price halted its sharp drop yesterday, bouncing off the ascending channel support illustrated in the previous post. Buyers seem to be getting back in the game at that point, possibly yielding another climb back to the resistance at $780. Technical indicators are giving mixed signals for now so a breakdown might still be possible. Technical Indicators Signals. The 100 SMA is above the longer-term 200 SMA so the path of....
Related News
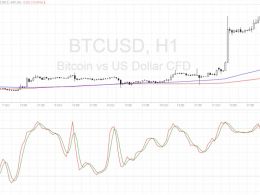
Bitcoin price is on a tear but is pausing in a bullish consolidation pattern before heading further north. Bitcoin Price Key Highlights. Bitcoin price recently established strong upside momentum after breaking above a short-term ascending channel. Price is consolidating from here as buyers are waiting for more bulls to join. An upside breakout or a major pullback could offer opportunities to hop in the ongoing climb. Technical Indicators Signals. The 100 SMA is above the longer-term 200 SMA so the path of least resistance is to the upside. In addition, the gap between the moving averages....
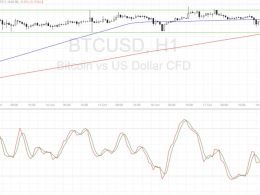
Bitcoin price could be due for a bounce off this support zone and technical indicators appear to be in agreement. Bitcoin Price Key Highlights. Bitcoin price underwent additional volatility and sold off yesterday but it appears to be testing another support area. Price is forming an ascending channel pattern on its 1-hour time frame and might be due for a bounce towards the resistance. Technical indicators are also suggesting that buyers could regain control. Technical Indicators Signals. The 100 SMA is crossing above the longer-term 200 SMA to confirm that the uptrend could carry on. In....
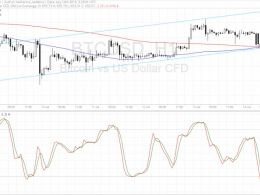
Bitcoin price could continue to consolidate but if a breakout occurs, technicals are favoring a downside move. Bitcoin Price Key Highlights. Bitcoin price is still stuck in its tight range on the short-term time frames, bouncing off support once more. A test of the near-term resistance could be in the cards but technical signals are pointing to a downside break. Buyers seem to be running out of momentum or traders are simply waiting for fresh market catalysts. Technical Indicators Signals. The 100 SMA is above the longer-term 200 SMA for now, which suggests that buyers still may have a bit....
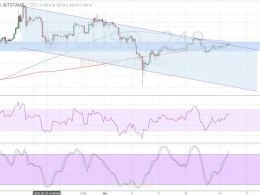
Potcoin Price Key Highlights. Potcoin price continued to trade inside a flag pattern as highlighted in one of the recent technical analysis. Both buyers and sellers seem to be struggling to take the price in one particular direction, which created a range inside the flag pattern. A few technical indicators are pointing towards more losses and a break below the flag pattern. Potcoin price is trading inside a range and it looks like heading towards a break, waiting for a catalyst. Break Down? As mentioned in the previous analysis, there was a sharp decline noted in the Potcoin price which....
Bitcoin price is testing the channel resistance once more, still deciding whether to make a bounce or a breakout. The 100 SMA is still above the 200 SMA for now with a downward crossover looming. If that happens, more sellers could join the fold and increase bearish pressure enough to lead to a drop until the channel support near $380. RSI is heading north so buyers are still in control but the oscillator is nearing the overbought levels. Stochastic is also heading up and approaching the overbought zone, which could mean that buyers are getting exhausted and ready to let sellers take over.....