Ethereum Price Weekly Analysis: Defies Gravity, Looks to Trade Higher
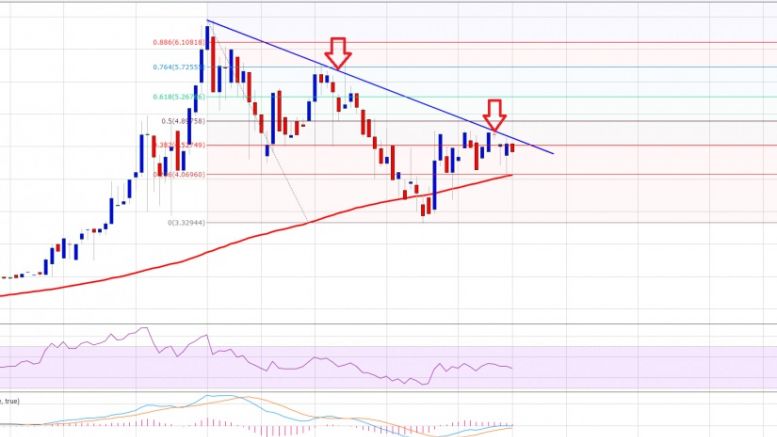
Ethereum price showing a few positive signs. If there is a break above the $4.40-50 level, then a move towards $6.00 is possible. Major Support Level is $4.10. Major Resistance Level may be $4.50. Ethereum price moved down by more than 25% recently and dived towards the $3.20-30 support area. The price has recovered and also moved above the 100 simple moving average (H4 chart, Kraken), which is a positive sign for buyers in the short term. It looks like buyers may attempt to take the price higher in the near term. However, there are many barriers on the upside waiting for them. The first....
Related News
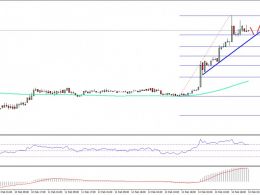
Ethereum price traded sharply higher against the US Dollar to trade above $12.50. ETH/USD now remains supported and could trade further higher. Key Highlights. ETH price busted higher against the US Dollar, and broke many important resistances like $11.20 and $12.00. At the moment, there is a connecting bullish trend line formed on the hourly chart of ETH/USD (data feed via SimpleFX) with support at $12.65. The pair may continue to remain in an uptrend since the bias has now changed to bullish. Ethereum Price Upside Momentum. We saw there were tiny range moves in ETH price against the US....
Dash Price Key Highlights. Dash price after the monstrous decline started a consolidation phase and trading in a range. A bearish trend line is formed, which if broken might call for an upside move in the near term. The chance of a move higher is increasing as sellers look exhausted. Dash price might spike higher once the consolidation period is over, but buyers need to get aggressive for the same. Break Higher? As highlighted in one of the recent posts, there was a major decline in the Dash price. However, the downside was stalled around 0.0111BTC after which the price started to trade in....
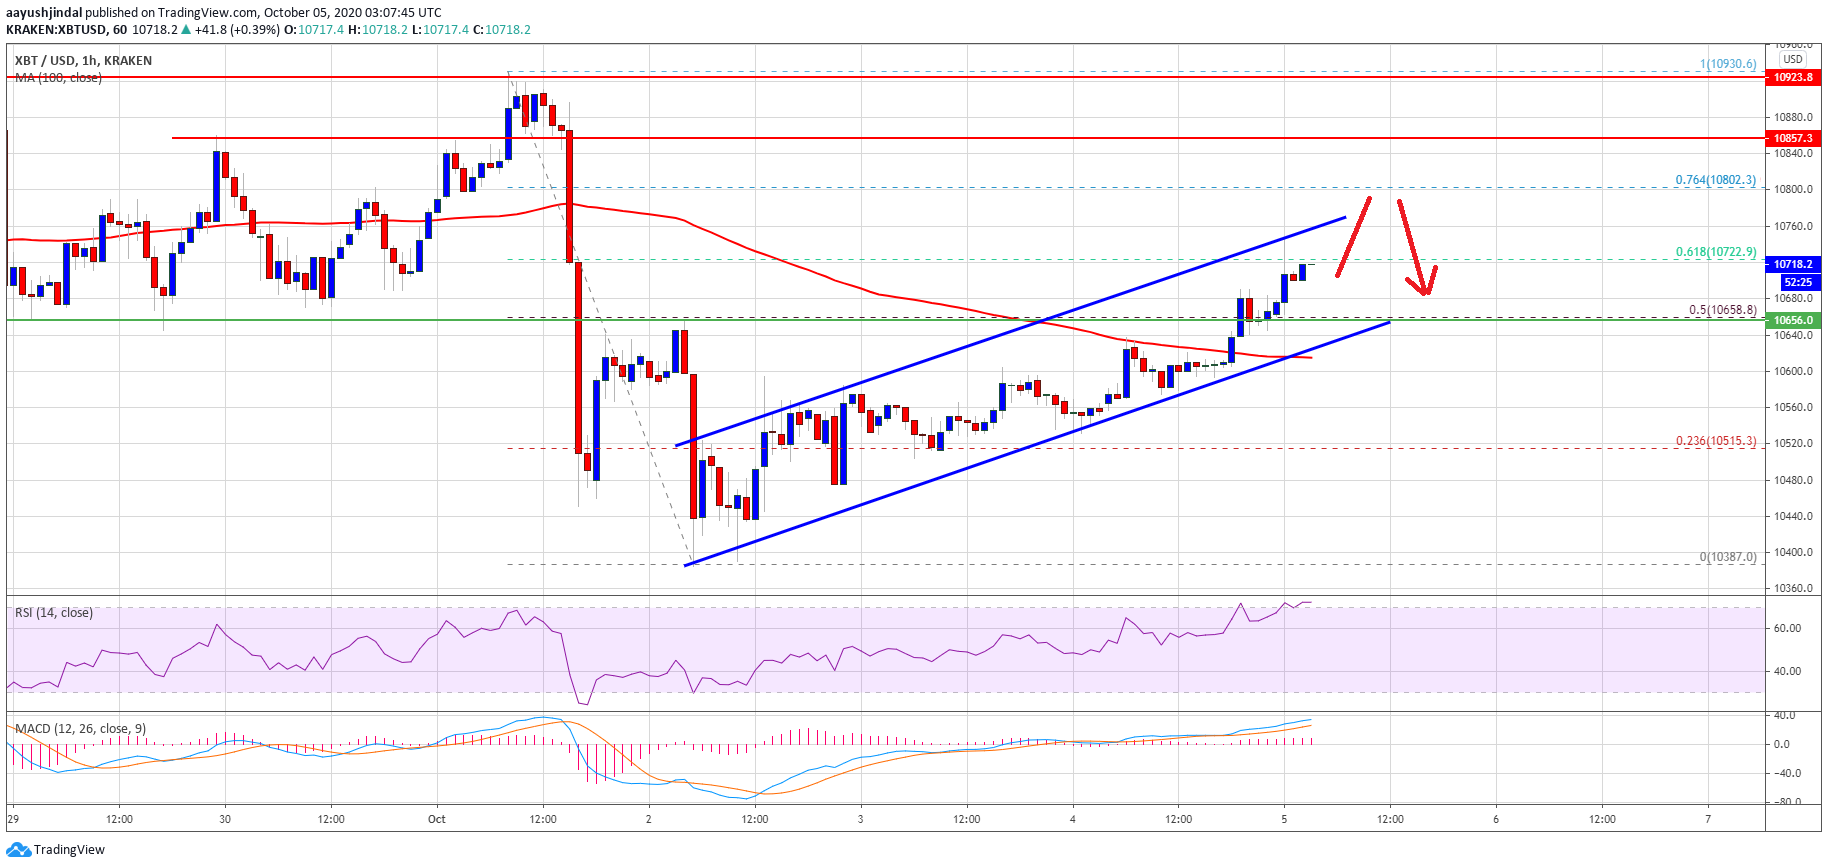
Bitcoin price is slowly recovering from the $10,387 low against the US Dollar. BTC broke the $10,650 resistance and it might soon test the $10,800 resistance or the $10,900 barrier. Bitcoin started a fresh upward move above the $10,550 and $10,650 resistance levels. The price is up 2%, and it is trading above the $10,700 […]
Ethereum ETH price regained its bullish trend against Tether (USDT) as it builds more strength to break above the key resistance ahead of “The Merge.” ETH price saw a rejection to a region of $1,500 recently as it could not hold its bullish trendline acting as support. (Data from Binance) Related Reading: Shiba Inu Burn Events Spark A Rally In Altcoin Over The Past Weeks Ethereum ETH Price Analysis On The Weekly Chart From the chart, the price of ETH saw its price rejected to a region of $1,540 on the weekly chart as the price was unable to hold $1,700 and the trendline acting....
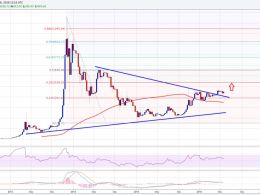
Bitcoin price looks bullish on a higher timeframe chart like the weekly chart, but the BTC bulls must capitalize and take it higher. Key Points. Bitcoin price may trade higher vs the US Dollar, as it looks it broke a major resistance area. There was a contracting triangle pattern formed on the weekly chart (data feed from Bitstamp) of BTC/USD, which was broken during the recent upside move. The price is now above the 100-weekly simple moving average, which is a positive sign for the BTC bulls. Bitcoin Price Crucial Break. Bitcoin price managed to slowly climb higher vs the US dollar, and....


