Ethereum Price Technical Analysis – ETH/USD Defies Gravity
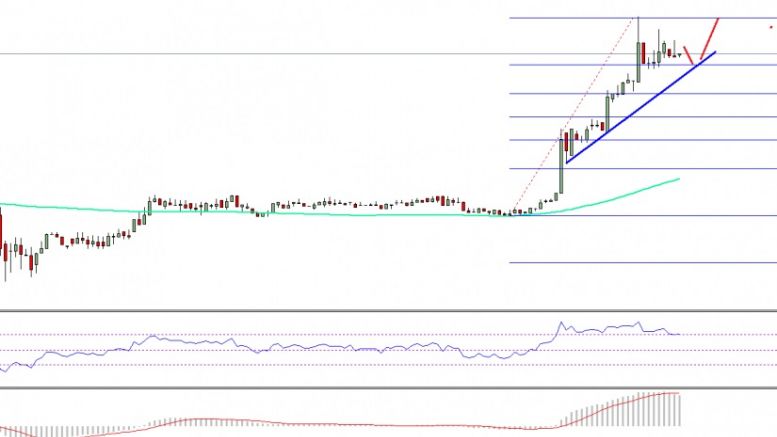
Ethereum price traded sharply higher against the US Dollar to trade above $12.50. ETH/USD now remains supported and could trade further higher. Key Highlights. ETH price busted higher against the US Dollar, and broke many important resistances like $11.20 and $12.00. At the moment, there is a connecting bullish trend line formed on the hourly chart of ETH/USD (data feed via SimpleFX) with support at $12.65. The pair may continue to remain in an uptrend since the bias has now changed to bullish. Ethereum Price Upside Momentum. We saw there were tiny range moves in ETH price against the US....
Related News
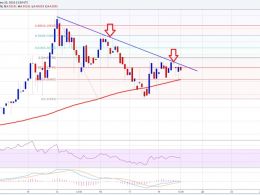
Ethereum price showing a few positive signs. If there is a break above the $4.40-50 level, then a move towards $6.00 is possible. Major Support Level is $4.10. Major Resistance Level may be $4.50. Ethereum price moved down by more than 25% recently and dived towards the $3.20-30 support area. The price has recovered and also moved above the 100 simple moving average (H4 chart, Kraken), which is a positive sign for buyers in the short term. It looks like buyers may attempt to take the price higher in the near term. However, there are many barriers on the upside waiting for them. The first....
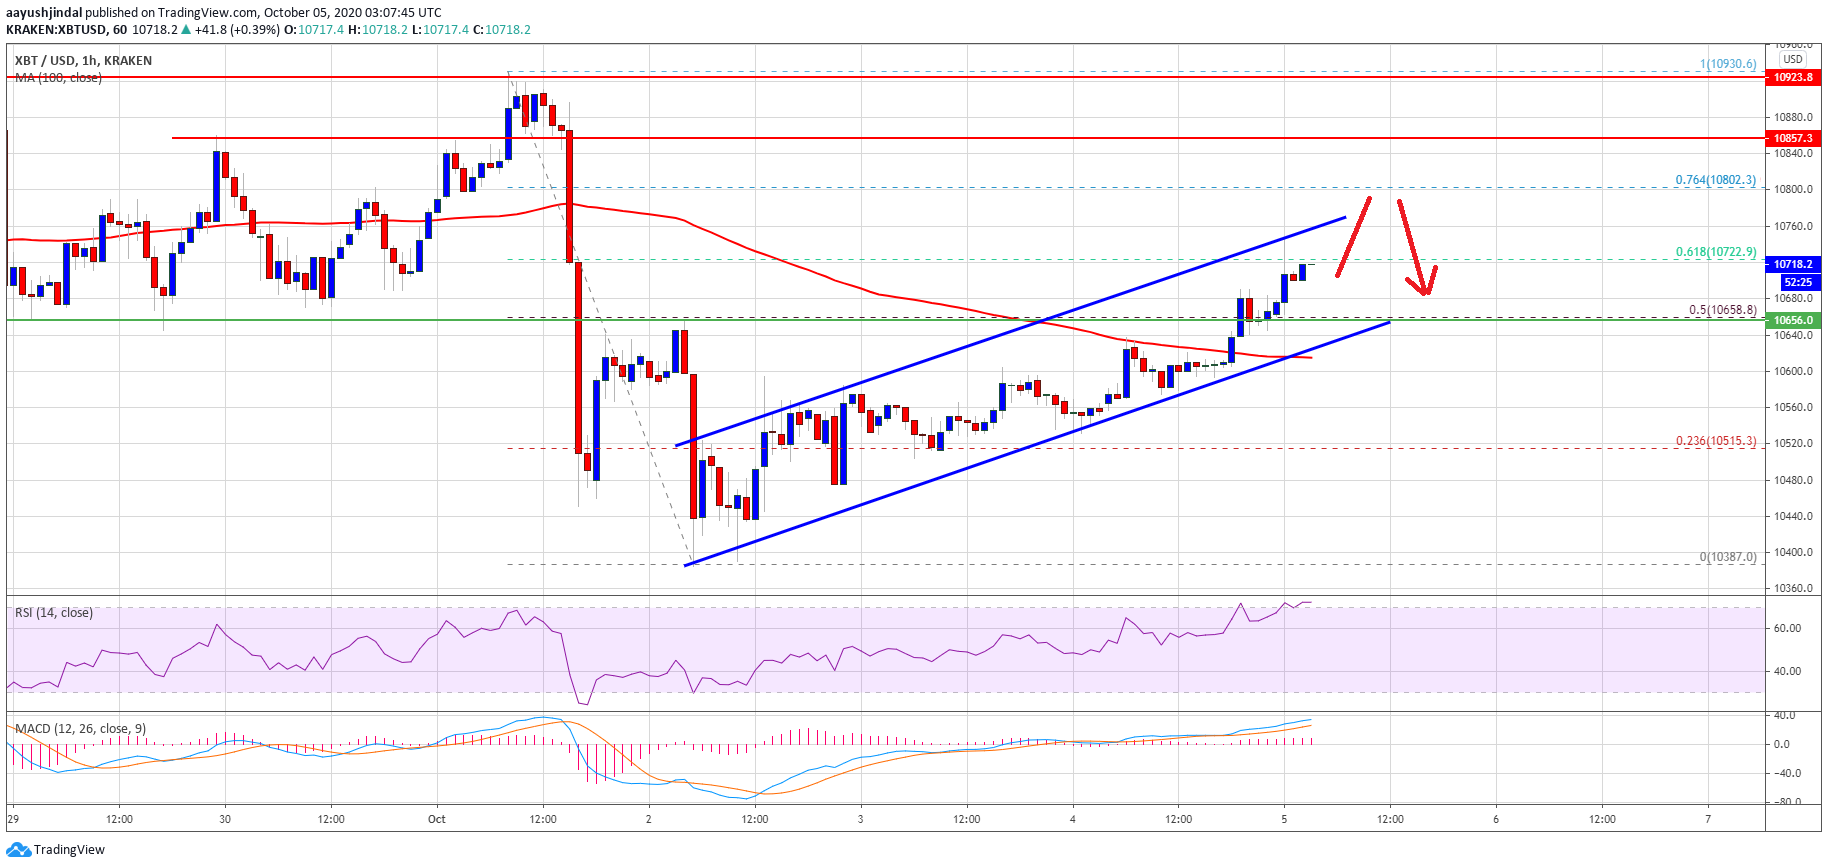
Bitcoin price is slowly recovering from the $10,387 low against the US Dollar. BTC broke the $10,650 resistance and it might soon test the $10,800 resistance or the $10,900 barrier. Bitcoin started a fresh upward move above the $10,550 and $10,650 resistance levels. The price is up 2%, and it is trading above the $10,700 […]

Even as valuation gets richer and technical indicators sound a warning, Litecoin continues to defy gravity as it closed yesterday at the highest level of the year - $3.063. Speculative buying has lifted the price even higher today, to $3.085. However, the rally is not an opportunity to enter into the highly overbought, technically weak cryptocurrency. Technical considerations derived from the 240-minute LTC-USD price chart have been given below. Litecoin Chart Structure - After hitting the yearly high of $3.194, Litecoin consolidated for a brief period. With yesterday's closing, bulls have....

"An open and interoperable bridge between Ethereum and Cosmos has long been a shared vision of a fully connected Interchain," said Althea CEO Deborah Simpier. On Wednesday, the Interchain Foundation, a Swiss non-profit serving as a steward of the Cosmos (ATOM) ecosystem, announced the launch of Gravity Bridge as built by decentralized internet service provider Althea. Gravity Bridge enables the transfer of ERC-20 tokens between Ethereum (ETH) and Cosmos blockchains. During its initial stages, Gravity Bridge will operate as a standalone chain before migrating to Cosmos Hub early next year.....

Bitcoin defies gravity and is surprisingly resilient against a wave of selling pressure from the Mt. Gox distribution. As of writing, not only is BTC firm above $60,000 but has managed to stand above $62,500, a level of interest especially by traders. So far, Bitcoin remains in an uptrend, and upbeat traders are looking at […]