Bitcoin Price Technical Analysis for 04/06/2016 – Nearing Channel Resistance
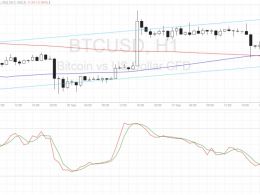
Bitcoin price might encounter near-term resistance at the top of the rising channel but the overall uptrend remains intact. The 100 SMA is above the 200 SMA so the path of least resistance is to the upside. If bullish pressure is strong enough, bitcoin price could even go for an upside break of the channel resistance, spurring a stronger rally for the virtual currency. RSI is treading sideways, indicating that consolidation could carry on and that buyers and sellers are still undecided. However, stochastic is already indicating overbought conditions so a selloff might take place sooner or....
Related News
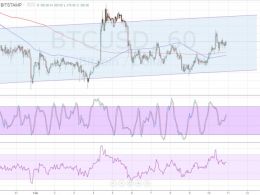
Bitcoin price is starting an uptrend on its 1-hour time frame and bulls could keep this rally going after a test of support. Bitcoin Price Key Highlights. Bitcoin price is slowly starting to trend higher on the short-term time frames once more, creating an ascending channel formation on its 1-hour chart. Price just came off a test of the channel resistance and is setting its sights back on support. Technical indicators are suggesting that the channel support could hold and allow bitcoin price to resume its climb. Technical Indicators Signals. The 100 SMA just crossed above the longer-term....
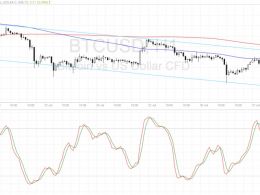
Bitcoin price could turn upon hitting the resistance at the top of the rising channel, possibly making its way towards support again. Technical indicators are giving mixed signals but it looks like the short-term uptrend might carry on. The 100 SMA is below the 200 SMA so the path of least resistance might be to the downside, signaling that the mid-channel area of interest could still keep gains in check. If so, bitcoin price could drop back to the channel support around $370-372. Stochastic is on the way up so there may be some buying pressure left enough to trigger a test of the....
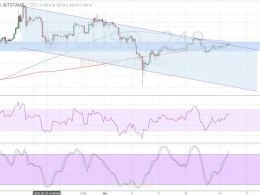
Bitcoin price is hovering at the resistance of the short-term descending channel and could be in for a continuation or reversal. Bitcoin Price Key Highlights. Bitcoin price seems to be establishing a downtrend now that it’s forming a descending channel on its 1-hour time frame. Price is now testing the channel resistance, still deciding whether to make a bounce or a break. Technical indicators seem to be indicating that the selloff could resume but there are also potential arguments for a reversal. Technical Indicators Signals. The 100 SMA is below the longer-term 200 SMA so the path of....
Bitcoin price is testing the channel resistance once more, still deciding whether to make a bounce or a breakout. The 100 SMA is still above the 200 SMA for now with a downward crossover looming. If that happens, more sellers could join the fold and increase bearish pressure enough to lead to a drop until the channel support near $380. RSI is heading north so buyers are still in control but the oscillator is nearing the overbought levels. Stochastic is also heading up and approaching the overbought zone, which could mean that buyers are getting exhausted and ready to let sellers take over.....
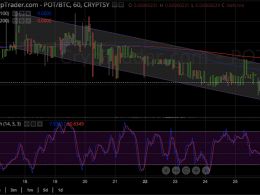
Potcoin Price Key Highlights. Potcoin price has been steadily trending lower, moving inside a descending channel pattern on the 1-hour time frame. Price is testing the latest lows and might be due for a move down to the channel support at 0.00000220BTC or lower. Potcoin price could carry on with its ongoing selloff, as technical indicators also confirm that further losses are likely. Bounce Off Channel Support? Potcoin price might still be able to take a break from its dive if the bottom of the descending channel holds as short-term support. In that case, price could head back up to the....

