Bitcoin Price Technical Analysis for 05/02/2016 – Bulls Regaining Control!
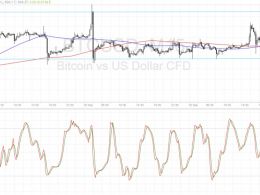
Bitcoin price showed strong bullish momentum with a consolidation breakout and a continuation pattern visible on the 1-hour chart. The 100 SMA is below the 200 SMA for now but it looks like an upward crossover is ready to take place, signaling a buildup in buying pressure. Stochastic and RSI are also heading down, which brings the possibility of profit-taking before further gains. If so, a pullback to the broken triangle resistance at $370 or the moving averages around $375 might take place. Once the oscillators reach the oversold areas and turn higher, bitcoin price could resume its....
Related News
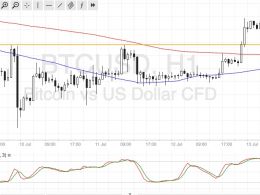
Bitcoin price could be due for another test of the short-term range support, with technical indicators supporting a bounce. Bitcoin Price Key Highlights. Bitcoin price has been treading carefully inside a tight range visible on its short-term charts. Price seems to have lost bullish momentum and is headed for the bottom of the range at $601.50. Technical indicators are hinting that losses could be kept in check. Technical Indicators Signals. The 100 SMA is above the longer-term 200 SMA on this time frame, hinting that the path of least resistance is still to the upside. In fact, bitcoin....
Bitcoin price could be ready to resume its climb now that this area of interest held as support. Bitcoin Price Technical Analysis. Bitcoin price recently made an upside breakout from a near-term resistance around $660. Price has found resistance at the $670 area and has since pulled back to the broken resistance, which appears to have held as support. This signals that bitcoin bulls could be ready to charge once more, although technical indicators are suggesting otherwise. Technical Indicators Signals. The 100 SMA is still below the longer-term 200 SMA so the path of least resistance is to....
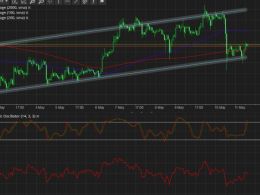
Bitcoin price is now testing the bottom of the ascending channel and technical indicators seem to be suggesting a bounce. The 100 SMA is above the longer-term 200 SMA so the path of least resistance is still to the upside. In addition, the 200 SMA is near the bottom of the channel and is currently holding as support around $450. Stochastic is on the move up from the oversold area, suggesting a pickup in buying pressure. This could take bitcoin price back up to the top of the channel at $460 or higher. Similarly, RSI is pointing higher, reflecting that buyers are regaining control. However,....
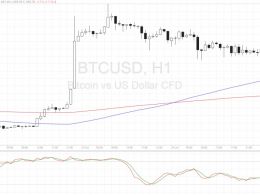
Bitcoin price seems to be regaining bullish momentum after breaking above this short-term consolidation pattern. Bitcoin Price Key Highlights. Bitcoin price recently made a strong rally but fell back in consolidation as bulls struggled to keep the momentum going. Buying pressure seems to be returning since price broke to the upside of the consolidation pattern and appears to have completed a quick pullback. Price could head back to the previous highs from here or carry on with a larger retracement. Technical Indicators Signals. The 100 SMA is still safely above the longer-term 200 SMA....
Bitcoin price appears to have chosen to take the northbound route and is waiting for more bulls to sustain the climb. Bitcoin Price Key Highlights. Bitcoin price is establishing a new uptrend, forming an ascending channel visible on its 1-hour chart. In addition, price seems to have broken above the symmetrical consolidation pattern illustrated in an earlier article, signaling further upside. Bitcoin is still testing an area of interest for the time being and technical indicators are giving mixed signals once more. Technical Indicators Signals. The 100 SMA is below the 200 SMA on this time....

