Bitcoin Price Technical Analysis for 05/02/2016 – Taking a Quick Break
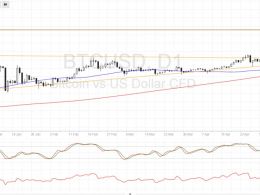
Bitcoin price could be due for a test of the short-term resistance but additional volatility could trigger a breakout in either direction. The 100 SMA is below the longer-term 200 SMA so the path of least resistance is to the downside. This means that a downside break from the consolidation pattern could be seen, taking bitcoin price on a longer-term selloff if a long red candle forms below $450. In addition, stochastic is heading down from the overbought area so price might follow suit if bearish momentum continues to pick up. RSI is on middle ground but appears to be turning lower to....
Related News
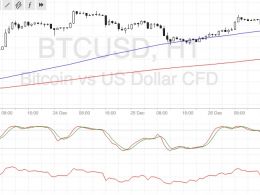
Bitcoin price has started a steady uptrend and might carry on, based on the new signals from technical indicators. The 100 SMA just crossed above the longer-term 200 SMA to confirm that the path of least resistance is to the upside. However, the channel resistance appears to be holding so a pullback to these dynamic support areas near the bottom of the channel might take place. RSI is on its way down, indicating that bitcoin price bears are in control of price action for now. In that case, a quick drop to the channel bottom is indeed possible, as stochastic is also heading down from the....
Bitcoin price could pull back as low as the broken triangle resistance before resuming its climb, as technical indicators are hinting at a quick selloff. Bitcoin Price Key Highlights. Bitcoin price appears to be taking a break from its sharp climb, offering buyers an opportunity to catch the uptrend on a pullback. Bitcoin recently broke out of a symmetrical triangle formation and has surged past the previous year highs at $500. Price peaked at $600 before showing signs of a correction. Technical Indicators Signals. The 100 SMA is above the 200 SMA for now, confirming that the longer-term....
Bitcoin price has shown strong upside momentum over the past few weeks and might be eyeing a test of these next ceilings. Bitcoin Price Key Highlights. Bitcoin price made another break higher over the weekend, indicating strong bullish momentum. Price is now testing another long-term area of interest around $700, at which either profit-taking or another upside breakout might be seen. Technical indicators are hinting that the rallies could pause but it would be helpful to look at the next potential resistance levels. Technical Indicators Signals. The 100 SMA is above the 200 SMA for now so....
Bitcoin price is taking a bit of a break from its ascent, probably waiting for more bulls to join in. Bitcoin Price Key Highlights. Bitcoin price recently made a strong surge, but it appears that bulls are running out of steam. A larger correction might be needed in order to draw more buyers to the mix and allow the climb to resume. Price is stalling just below the latest highs near $940 and appears to be testing near-term support areas. Technical Indicators Signals. The 100 SMA is above the longer-term 200 SMA on the 1-hour chart, confirming that the path of least resistance is still to....
Bitcoin Price Key Highlights. Bitcoin price has been on a steady decline, erasing most of its sudden gains from earlier in the month. Although bears still seem to be in control, selling pressure could fade once bitcoin price hits support at the $300 mark. Bitcoin price could be due for a quick bounce if profit-taking takes place around the nearby major support zone. Breakdown Possible? Technical indicators seem to be indicating that bearish momentum could stay in play for much longer, as the short-term 100 SMA is below the longer-term 200 SMA. Stochastic is pointing down once more, after....


