Bitcoin Price Technical Analysis for 05/31/2016 – Bullish Continuation Pattern?
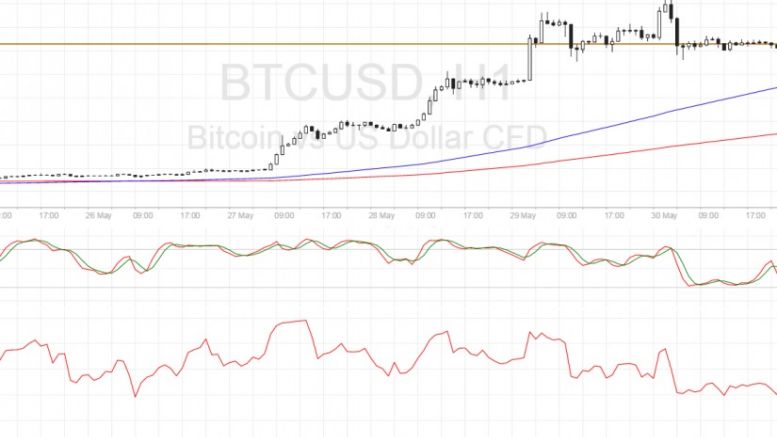
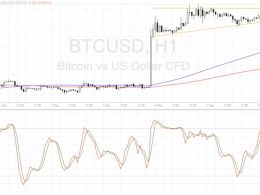
Bitcoin price is pausing from its recent sharp climb, an indication that bulls are waiting for more signals to head higher. The 100 SMA is above the 200 SMA so the path of least resistance is still to the upside. The gap between the moving averages is widening so bulls are gaining more energy. For now, there are enough buyers located around the $565 level which is currently holding as near-term support. A long green candle closing past the $600 mark could confirm that more buyers have joined the mix and are ready to push bitcoin price higher. The breakout was spurred by more Chinese....
Related News
Bitcoin Price Key Highlights. Bitcoin's price is stuck in a consolidation pattern once more, as bulls are taking a break from their recent strong rally. This type of consolidation pattern has already been seen in the past, with Bitcoin's price making an upside breakout from the bullish continuation signal. The Bitcoin price has formed a bullish flag pattern on its 1-hour time frame, which suggests that more buyers could join the game once an upside breakout occurs. How High Can It Go? The mast of the bullish flag continuation pattern is approximately $30 in height, spanning from $395 to....
Bitcoin price looks ready continue is dive on a break of this bearish continuation pattern, with technicals signaling further declines. Bitcoin Price Key Highlights. Bitcoin price recently made a sharp break below a short-term consolidation pattern, which means that sellers have taken control. Price seems to have formed a bearish continuation signal as more sellers could take it down. Technical indicators are also confirming that selling pressure is mounting. Technical Indicators Signals. The 100 SMA is moving below the longer-term 200 SMA, confirming that the path of least resistance is....
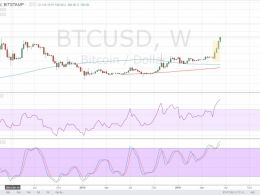
Bitcoin price has formed a three white soldiers pattern on its weekly chart, confirming that further gains are in the cards. Bitcoin Price Key Highlights. Bitcoin price could be in for a continuation of its bullish run after this chart pattern formed on its weekly time frame. A three white soldiers formation can be seen with those three bullish candlesticks after a brief period of consolidation. This signals that buyers aren’t done with their rallies, potentially taking bitcoin price to the next area of interest at $800-850 then onto $900-1,000. Technical Indicators Signals. The 100 SMA is....
Bitcoin price continued to rise yesterday scoring a high of $244. The pattern of the new bullish wave has been established as we explained during our yesterday's "intraday tips" article. By analyzing the 1 day Bitfinex (BTC/USD) charts and plotting the RSI and the 20 day EMA accordingly (look at the below chart), we can conclude the following: The current bullish trend can be viewed as a continuation of the bullish wave that started on the 15th of January, if we consider that the first bullish rally had been halted by a price correction wave that triggered sideways movements for a few....
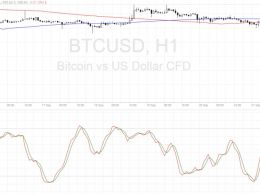
Bitcoin price is still moving in tight consolidation, but this appears to be a continuation signal from the previous strong move. Bitcoin Price Key Highlights. Bitcoin price is still stuck in consolidation, as traders are waiting for bigger market catalysts before deciding which direction to take. Keep in mind that bitcoin just recently made a strong rally, which makes the consolidation pattern a bullish flag. Technical indicators seem to be suggesting that an upside breakout is likely. Technical Indicators Signals. The 100 SMA is above the longer-term 200 SMA on this time frame,....