Bitcoin Price Technical Analysis for 06/20/2016 – Potential Selloff Levels
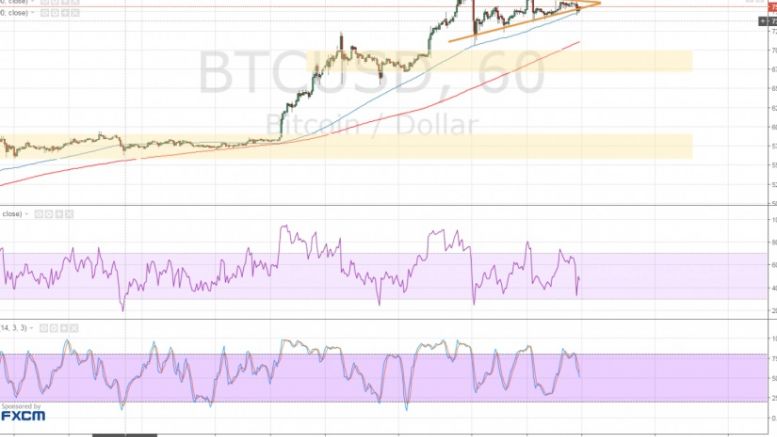
Bitcoin price could be in for a sharp drop if traders decide to book profits off their recent long positions. Bitcoin Price Key Highlights. Bitcoin price made a strong weekend rally as expected and is back in consolidation once more. A symmetrical triangle formation can be seen on the 1-hour time frame, indicating hesitation among both bulls and bears. Signs of rally exhaustion were seen in the past week, which suggests that profit-taking activity could happen. Technical Indicators Signals. The 100 SMA is above the 200 SMA, which means that the path of least resistance is to the upside and....
Related News
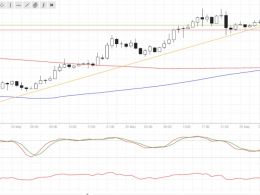
Bitcoin price made a break of the short-term trend line support, signaling a potential selloff from here. Bitcoin Price Key Highlights. Bitcoin price had been moving above an ascending trend line on its 1-hour time frame. Price just made a downside break of support as risk aversion seems to be back in the financial markets. This could be an early signal of a pending selloff, although technical indicators are still giving mixed signs. Technical Indicators Signals. The 100 SMA is starting to cross above the longer-term 200 SMA, which suggests potentially stronger buying pressure. If so,....
Bitcoin price could be due for a quick selloff at this point, as profit-taking might happen ahead of the weekend and next week’s EU referendum. Bitcoin Price Key Highlights. Bitcoin price has been on a tear these days but some technical indicators are hinting at an exhaustion. Price is closing in on the $800 level, which is an area of interest visible on longer-term time frames. If a selloff is seen at the current levels, it could find nearby support at $700. Technical Indicators Signals. The 100 SMA is above the 200 SMA for now so the path of least resistance is to the upside. In....
Bitcoin price appears to be making a correction from its downtrend, with several inflection points lined up around $660. Bitcoin Price Key Highlights. Bitcoin price recently made a selloff but it has since pulled up from this dive. A descending trend line can be drawn to connect the recent highs of price action on the 1-hour time frame since the start of this month. Price could pull up to this trend line before the selloff resumes. Technical Indicators Signals. Bitcoin price is currently stalling at an area of interest at $645, which previously held as support and is now holding as a....
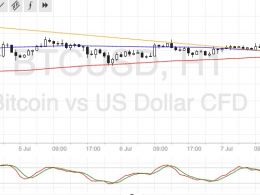
Bitcoin price is establishing a new downtrend after breaking below an area of interest. More bears are waiting at this retest of the broken support. Bitcoin Price Key Highlights. Bitcoin price recently broke below an area of interest marked in an earlier article, indicating that a downtrend might be due. Price is now pulling back up to this area for a retest before gaining more traction in its selloff. If the near-term resistance holds, bitcoin price could make its way back down to the recent lows at $685. Technical Indicators Signals. The 100 SMA is still above the 200 SMA for now but the....
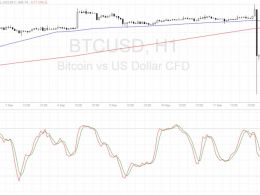
Bitcoin price is pulling up from its sharp drop but could encounter resistance at the nearby inflection points. Bitcoin Price Key Highlights. Bitcoin price recently made a sharp selloff, breaking below a short-term floor around $620 and bouncing off the $570 area. Bearish momentum could still be in play, although a correction to the broken support seems imminent. Technical indicators are also suggesting that the selloff could resume at some point. Technical Indicators Signals. The 100 SMA is starting to cross below the longer-term 200 SMA to show that the path of least resistance is to the....


