Bitcoin Price Technical Analysis for 05/26/2016 – Short-Term Selloff
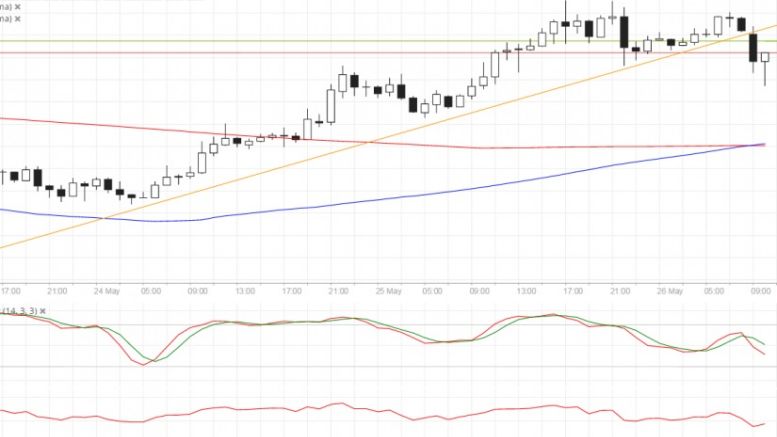
Bitcoin price made a break of the short-term trend line support, signaling a potential selloff from here. Bitcoin Price Key Highlights. Bitcoin price had been moving above an ascending trend line on its 1-hour time frame. Price just made a downside break of support as risk aversion seems to be back in the financial markets. This could be an early signal of a pending selloff, although technical indicators are still giving mixed signs. Technical Indicators Signals. The 100 SMA is starting to cross above the longer-term 200 SMA, which suggests potentially stronger buying pressure. If so,....
Related News
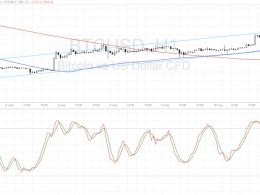
Bitcoin price could be ready to resume its selloff upon testing the descending channel resistance visible on its short-term charts. Bitcoin Price Key Highlights. Bitcoin price is still trending lower on its short-term time frames, moving inside a descending channel on its 1-hour chart. Price is on a climb but might be due for a selloff soon since it is already near the ceiling at the channel resistance. A short-term double-top can be seen, also suggesting a reversal from the recent rally. Technical Indicators Signals. The 100 SMA is below the 200 SMA on this time frame, which means that....
Bitcoin price appears to be correcting from its recent selloff but technical indicators are signaling that a longer-term bounce might be in order. Bitcoin Price Key Highlights. Bitcoin price is pulling up from its recent slide but could be in for more gains if sellers hop in the short-term area of interest. Support at $555 was previously broken and might hold as resistance moving forward. Technical indicators, however, are suggesting that the climb could continue. Technical Indicators Signals. The 100 SMA is safely above the 200 SMA so the path of least resistance is still to the upside.....
Bitcoin price is stuck in consolidation on its short-term time frames but could be poised for a breakout soon. Bitcoin Price Key Highlights. Bitcoin price has been treading sideways recently and has formed a symmetrical triangle formation on its 15-minute chart. A breakout could be due sooner or later since price is approaching the triangle’s peak. Technical indicators are giving mixed signals on this time frame but longer-term charts suggest that the uptrend could remain intact. Technical Indicators Signals. The 100 SMA is below the longer-term 200 SMA on this chart so the path of least....
Bitcoin price could be in for a selloff now that it broke below the short-term channel support and is testing the next inflection point. Bitcoin Price Key Highlights. Bitcoin price was previously trending higher on its short-term time frames, moving inside an ascending channel visible on the 30-min and 1-hour charts. Price was rejected on its test of resistance and made its way back down to the channel support as expected. However, this floor broke down, signaling that a reversal from the uptrend may be in order. Technical Indicators Signals. The 100 SMA is still above the longer-term 200....
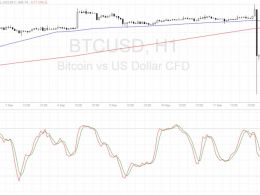
Bitcoin price is pulling up from its sharp drop but could encounter resistance at the nearby inflection points. Bitcoin Price Key Highlights. Bitcoin price recently made a sharp selloff, breaking below a short-term floor around $620 and bouncing off the $570 area. Bearish momentum could still be in play, although a correction to the broken support seems imminent. Technical indicators are also suggesting that the selloff could resume at some point. Technical Indicators Signals. The 100 SMA is starting to cross below the longer-term 200 SMA to show that the path of least resistance is to the....


