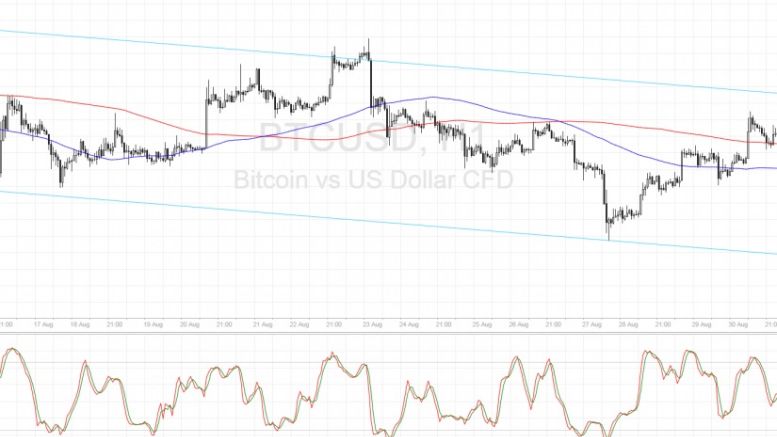
Bitcoin Price Technical Analysis for 08/31/2016 – Near a Ceiling
Bitcoin price could be ready to resume its selloff upon testing the descending channel resistance visible on its short-term charts. Bitcoin Price Key Highlights. Bitcoin price is still trending lower on its short-term time frames, moving inside a descending channel on its 1-hour chart. Price is on a climb but might be due for a selloff soon since it is already near the ceiling at the channel resistance. A short-term double-top can be seen, also suggesting a reversal from the recent rally. Technical Indicators Signals. The 100 SMA is below the 200 SMA on this time frame, which means that....
Related News

Bitcoin price is pushing toward its three-month resistance ceiling. Technical and sentiment analysis argue for a return to decline, and fundamental analysis shows that Bitcoin’s value is more fragile than many realize. Friday’s technical analysis concluded that the outlook for bitcoin price is bearish while price fails to break above the prevailing resistance ceiling (blue down-sloping line in the chart). Going forward, technical analysis will be informed by the position of price in relation to this ceiling: if the market can successfully trade price above it, we can expect continuing....

Bitcoin price is reattempting a move higher but the progress is slow and both technical and sentiment analysis shows a bearish mood in the chart. Yesterday’s technical analysis concluded that the outlook for bitcoin price is bearish while it fails to break above the prevailing resistance ceiling (blue down-sloping line in the chart). Ongoing analysis is informed by the position of price in relaiton to this ceiling: if the market can successfully trade price above it, we can expect continuing advance. As long as price remains below it, we can expect another series of lower lows. Mood....
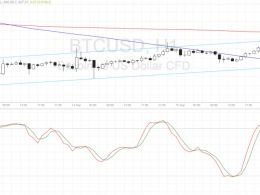
Bitcoin price is sustaining its climb but there are technical signals hinting at a possible selloff. Bitcoin Price Key Highlights. Bitcoin price is still trending higher, moving inside an ascending channel pattern on its 1-hour chart. Price is cruising around the mid-channel area of interest, as buyers and sellers are likely waiting for more directional market clues. Technical indicators seem to be suggesting that a reversal is imminent, though. Technical Indicators Signals. The 100 SMA is below the longer-term 200 SMA so the path of least resistance is to the downside. Also, the gap....

Bitcoin price continues scratching out a non-committal path around $420 and 2800 CNY. Another attempt at advance is not out of the question, but the prospect of a labored decline looms. The outlook for bitcoin price is bearish. In the coming days we will cover the three pillars of analysis with respect to the bitcoin chart: technical, sentimental and fundamental. Today’s article considers the chart technicals. The 4-hour chart shows a repeating pattern of price action since mid December: the market cautiously approaches a down-sloping ceiling and then sells off rapidly. The last three....
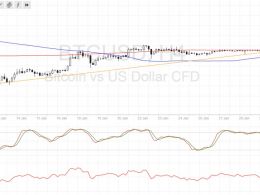
Bitcoin price is enjoying upside momentum for now and might be on track towards testing the next ceiling at $1100. Bitcoin Price Key Highlights. Bitcoin price made a strong upside break from consolidation, signaling strong bullish momentum. Price continued its climb past the $1000 mark and could be aiming for the next resistance from here. Technical indicators are showing mixed signals so a pullback could be due before bitcoin price heads further north. Technical Indicators Signals. The 100 SMA is still below the longer-term 200 SMA on the 4-hour time frame so the path of least resistance....