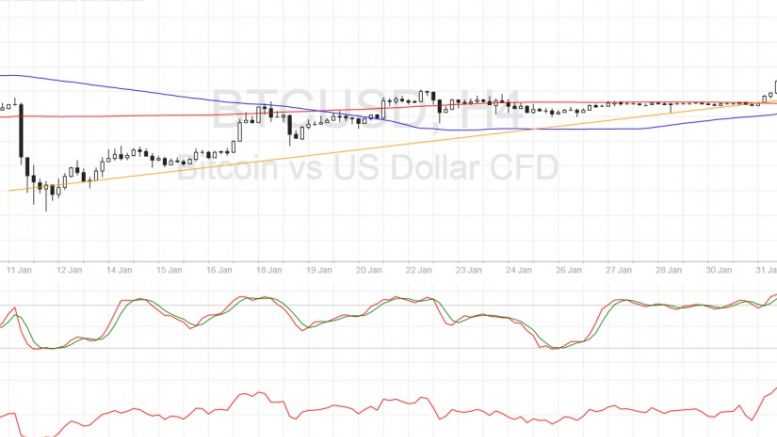
Bitcoin Price Technical Analysis for 02/02/2017 – Next Upside Targets
Bitcoin price is enjoying upside momentum for now and might be on track towards testing the next ceiling at $1100. Bitcoin Price Key Highlights. Bitcoin price made a strong upside break from consolidation, signaling strong bullish momentum. Price continued its climb past the $1000 mark and could be aiming for the next resistance from here. Technical indicators are showing mixed signals so a pullback could be due before bitcoin price heads further north. Technical Indicators Signals. The 100 SMA is still below the longer-term 200 SMA on the 4-hour time frame so the path of least resistance....
Related News
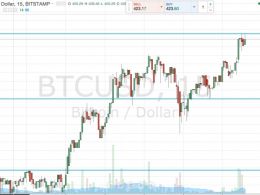
Bitcoin price could be due for more gains after this upside breakout, possibly aiming for the $750 level next. Bitcoin Price Key Highlights. Bitcoin price made a strong upside break of the near-term resistance marked in a previous article. This suggests that bulls are gaining strength and could push price to the next ceiling. At the moment, bitcoin is testing the area of interest at $700, which is a major psychological level. Technical Indicators Signals. The 100 SMA is above the longer-term 200 SMA so the path of least resistance is to the upside, even on this daily chart. However, the....

Bitcoin price is, at the time of writing, breaking out of a consolidation above $600. The market has noticed and the chatrooms are speculating if this is a time to buy. Technical analysis confirms the corrective rally proposed in yesterday’s analysis. Bitcoin price had been sticking to the Fib line near $633 (Bitstamp) and the 4hr 200MA (not shown) has risen up into the area of price action to provide additional support. After a period of consolidation, MACD Bollinger Band compression confirms the onset of price volatility. This is the typical configuration prior to a breakout, and....
Unlike last week, when we tried to incorporate a range of technical charting patterns into our bitcoin price trading strategy, this week’s strategy has been pretty straightforward. When we see s sustained directional bias (in this case, to the upside) it’s often just a matter of stepping up the key levels with each new formation swing high, and rerunning the same approach – similar distance targets, tights stops, nothing too aggressive. In yesterday’s analysis we set up against a potential upside break, and overnight we got the break – not without a brief downside correction, however, but....

Shortly before markets closed in the UK yesterday evening, we published our twice-daily bitcoin price technical analysis piece. The piece focused on the levels that we had slated throughout the day as our ones to watch, and suggested that if we saw a break of any of these levels, or a bounce from any of them, we would enter a position accordingly and ride it to one of our targets. Action has now matured overnight, and we are heading into a fresh European session this morning. With this said, what are the levels we're keeping an eye on in the bitcoin price, and the reaching of what levels....

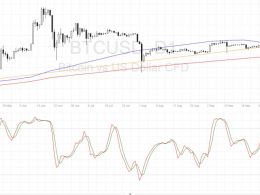
This analysis report take an historical perspective of the BTC/USD price chart. In the absence of the most complete historical price chart, namely that of Mt. Gox, this report will use the BTC-e chart, and try to make sense of all its spikes and idiosyncracies, in an effort to make both medium / long term forecasts and price predictions for the BTC/USD pair. Takeaway. Technical analysis reveals that BTC/USD has a medium term upside target above $2,000 (see chart below). However, there is no conclusive sign that the decline since December 2013 is over. A break above the upper resistance TL....