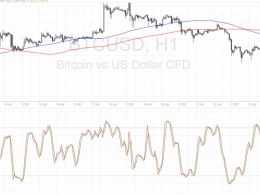
Bitcoin Price Technical Analysis for 07/05/2016 – Stalling Halfway!
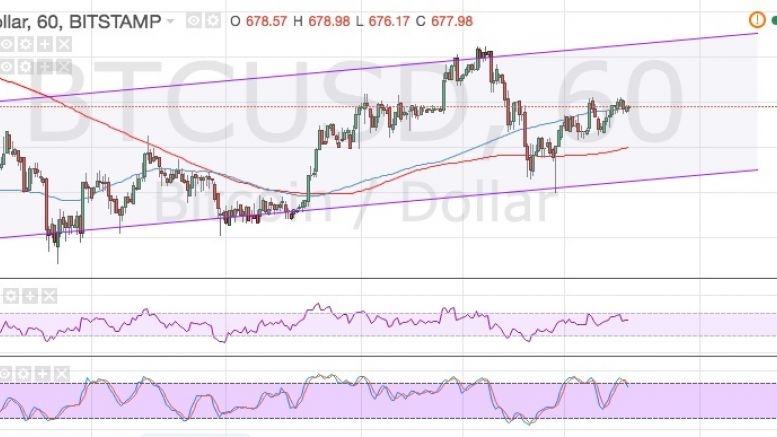
Bitcoin price could be in for more volatility today as US traders return from their Fourth of July holiday. Bitcoin Price Key Highlights. Bitcoin price continues to trend higher, still inside its ascending channel pattern visible on the 1hour time frame. However, price seems to be stalling at an area of interest around the middle of the channel. If this holds as resistance, bitcoin price could be in for another test of support around $650. Technical Indicators Signals. The 100 SMA is still above the 200 SMA so the path of least resistance is to the upside. The 100 SMA lines up with the....
Related News
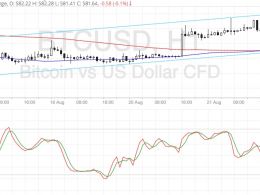
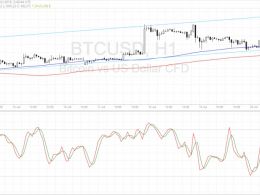
Bitcoin price is having trouble breaking past this area of interest visible on the daily time frame as technical indicators are giving mixed signals. Bitcoin Price Key Highlights. Bitcoin price is still stuck in consolidation on its short-term time frames and looking at the daily chart shows why. Price is actually stalling below a former support zone around the $600-620 area, which might continue to hold as resistance. Price is also encountering a bit of a ceiling around its 100 SMA on the longer-term chart. Technical Indicators Signals. The 100 SMA is above the longer-term 200 SMA on this....
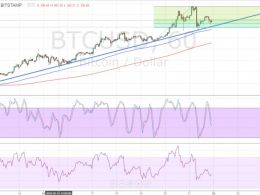
Bitcoin price could be due for a bounce off the channel support, with technical indicators reflecting the presence of buying momentum. Bitcoin Price Key Highlights. Bitcoin price has been steadily climbing on its 1-hour chart, moving inside an ascending channel pattern. Price bounced off the top of the channel once more and is now making a move towards support. If this area holds as a floor once more, bitcoin price could make its way back up to the channel resistance. Technical Indicators Signals. The 100 SMA just crossed above the 200 SMA to indicate that the path of least resistance is....
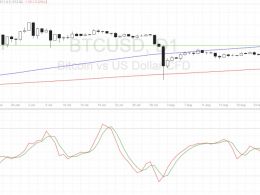
Bitcoin price is once again testing the rising trend line support and might be due for another bounce to its previous highs and beyond. Bitcoin price already bounced off the 61.8% Fibonacci retracement level at $428.58 and appears ready to climb to the swing high at $447.94. However, buyers still seem hesitant and are still waiting for more bulls to join the fold. For now, price is stalling at the 50% Fib at $432.15 and might need another quick test of the trend line, which lines up with the 100 SMA. Speaking of the moving averages, the short-term 100 SMA is still above the longer-term 200....
Bitcoin price seems to be establishing a downtrend after confirming a reversal pattern, and technical indicators support this view. Bitcoin Price Key Highlights. Bitcoin price recently formed a head and shoulders pattern on its short-term time frames, signaling that the recent uptrend may be over. Price has broken below the neckline support, which held as resistance on the retest. This adds confirmation that further losses are possible so it’s time to look at the nearby inflection points and areas of interest for potential targets. Technical Indicators Signals. The 100 SMA is still below....
Bitcoin price made a downside break from its ascending channel pattern, signaling that a reversal is about to take place. Bitcoin Price Key Highlights. Bitcoin price was previously trading inside an ascending channel before making a break lower, indicating a reversal from the short-term uptrend. Price also broke below the nearby inflection points, which means that sellers are gaining traction. For now, technical indicators are suggesting that the uptrend might still carry on but that could change soon. Technical Indicators Signals. The 100 SMA is still above the longer-term 200 SMA so the....