Ethereum Price Technical Analysis – ETH Preparing For Break
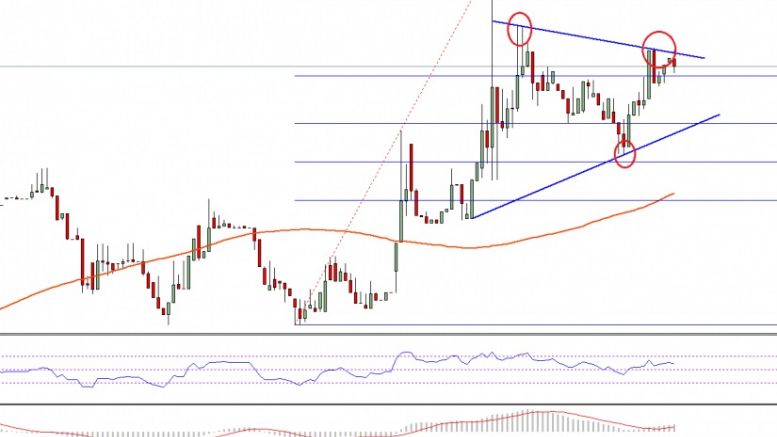
Ethereum price is currently trading with a positive bias against the US Dollar, and if the current trend remains intact more gains are likely. Key Highlights. Ethereum price after surging higher started a correction yesterday, and currently preparing for a break. There is a contracting triangle pattern formed on the hourly chart (data feed via Kraken) of ETH/USD, which may provide us the next move. My idea of buying continued to play well, as the ETH bulls bought every major dip in ETH/USD. Ethereum Price Resistance. Ethereum price ETH started a correction phase yesterday after a strong....
Related News
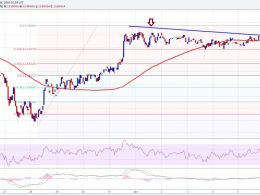
Ethereum price is consolidating, and may be setting up for the next move. Will it move higher or break down vs the US dollar? Key Highlights. Ethereum price stayed in the bullish zone vs the US Dollar, and it looks like it is consolidating before the next move. There is a bearish trend line formed on the hourly chart (data feed via Kraken) of ETH/USD, which is acting as a resistance for an upside move. A continuous failure to trade higher may call for a downside break in ETH in the short term. Ethereum Price – Watch For A Break. Ethereum price ETH attempted on a couple of occasions to....
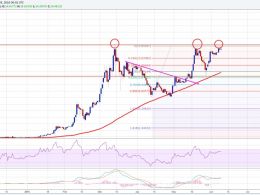
Ethereum price is trading near a major confluence resistance area of $15.00. Let us see how we can trade ETH/USD in the current situation. Key Highlights. Ethereum price stayed elevated against the US Dollar, but I think one should trade carefully moving ahead. There is a monster resistance area formed near $15.00, which acted as a barrier on many occasions. There is likely a Triple top pattern forming on the daily chart (data feed via Kraken) of ETH/USD, which if valid might call for losses. Ethereum Price Triple Top? Ethereum price ETH for the third time trading near the $15.00....
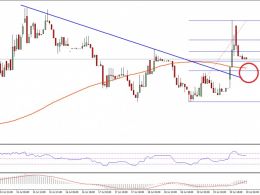
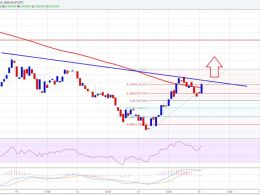
Ethereum price traded higher intraday, and looking at the current technical indicators it looks like it may trade further higher. Key Highlights. Ethereum price managed to move higher against the US Dollar and broke a major resistance area. Yesterday’s highlighted bearish trend line on the hourly chart (data feed via Kraken) of ETH/USD was broken during the recent upside ride. The price is now above the 100 hourly simple moving average, which is a positive sign for the bulls. Ethereum Price Buy. Ethereum price ETH surged higher against the US Dollar and posted a critical break intraday (as....

Technical analysis shows that Ethereum’s price action is currently completing a market structure that shows signs of revival. After weeks of struggling below key levels, Ethereum now appears to have completed a market structure break, with a technical analyst pointing to $1,500 as the zone where buyers have regained control, and a break above $4,000. Ethereum Structure Break And The $1,500 Turnaround Point Crypto analyst SwallowAcademy, in a recent technical breakdown of Ethereum’s weekly candlestick chart, noted that buyers have successfully initiated a clean market structure....
Ethereum price traded down near $7.0 where buyers appeared. Currently, it looks like there is a chance of ETH/USD breaking higher in the short term. Ethereum price ETH made a perfect bottom near $7.0. I highlighted in yesterday’s analysis that there is a chance of ETH/USD moving down towards $7.0, which can then produce a bounce. The price did test the mentioned level and moved higher later. There was a nice upside reaction, signaling more gains in the near term. ETH/USD is currently attempting to break a bearish trend line on the hourly chart (data feed via Kraken), which is also....