Bitcoin Price Decline Complete?
Bitcoin price decline is on hold as the market chooses the upside. Is this the start of a new advance, or merely advance in a correction? Bitcoin price spent the past 24 hours in a sideways holding pattern. At the time of writing a surge higher began from the day’s hourly candle closing low. The Elliott wave count from the recent top is labeled and the present upside wave remains consistent with an ABC correction. If this wave count is correct, then we’d expect wave C to target the 1.618 Fib extension of wave A at $664. This will also be the approximate level of the 1hr 200MA, as well as a....
Related News
Bitcoin price has found structural support in the chart and has started a tentative (but uncertain) advance. Caution into year-end. Price seems to have found support near $400 and 2600 CNY and has been making slow but steady advance in a pattern that is not yet clearly impulsive. It may still be a correction before drawing sideways or even setting up additional decline. Assuming for now that the decline is complete, and seeing that price is advancing, there is an imminent reverse divergence (magenta) to both the 1hr MACD and RSI awaiting price if it advances higher in the chart.
Bitcoin price fell away from yesterday’s strained highs, but a price correction introduces some uncertainty about what’s next. Previous price patterns suggest the decline will continue, but simple technical analysis helps us plan contingency, and identify the confirmation of decline. xbt.social subscribers opened a short position after a combination sell signal fired in both the 1-hour and 15-min charts, earlier today. It is not unusual for the market to test the 1hr 20MA after an initial wave of decline. Magenta arrows in the 1hr OKCoin futures chart, illustrates this corrective pattern.....
Bitcoin price slammed through several layers of support to hit a previous long-term resistance level at $465. Although the market seems to have found a bottom, there is not yet any technical reason to believe the decline is complete. Now is the time to count your money and sit out of the market for a few days or weeks. The 4-hour and 1-day timeframe charts gave us MA sell signals, and the 3-day chart gave us MACD and stochastic bearish signals. During the overlap of the late US trading session and early Asia-Pacific sessions, bitcoin price was sold to the resistance-turned-support level at....
Bitcoin price declined an additional $30 today and is currently being supported at $357. Additionally, 4-hour RSI shows a well-defined five wave channel to today’s low. According to Elliott wave principle, the decline should now be complete, but the Bitcoin price chart regularly forms waves consisting of seven subwaves, so there is no reason to call the bottom just yet. Note that RSI (panel immediately above price) has reverse diverged to the closing low of 11 November 2015 (magenta arrow) and that MACD (top panel) confirms this reverse divergence with a double bottom (not annotated). The....
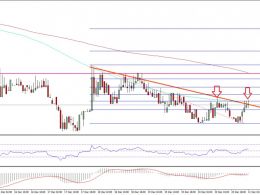
Ethereum price after a dip against the US Dollar started recovering. The ETH/USD pair currently is looking to break a short-term resistance. Key Highlights. ETH price made a minor low at $7.40 against the US Dollar, and started correcting higher. There is a bearish trend line formed on the hourly chart (data feed via SimpleFX) of ETH/USD, which the pair is attempting to break at the moment. A close above the trend line resistance may call for a move towards $7.75. Ethereum Price Resistance. There was a minor decline in ETH price versus the US Dollar yesterday, as the price traded below....


