
Technical Analysis: Bears Taking Hold of Bitcoin Price
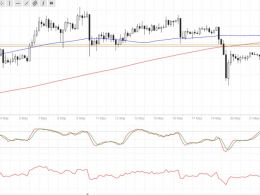
The bitcoin price is ready to fall. After a large sideways lateral market, prices are about to dive to $600, where a new cycle is expected to start, ultimately resulting with a rebound to $820. Bitcoin Price Heading South, Preparing for Rebound Into New Bull Pattern. Prices are still moving in a lateral pattern, sustaining the $680 level that is persisting at press time. This situation is about to end, though, with a bear movement that should test the support in the $600 zone. The main pattern that has recovered this level, which was originally lost in 2014, is over. Another cycle is....
Related News

Bitcoin Price Key Highlights. Bitcoin price has been on a steady decline, erasing most of its sudden gains from earlier in the month. Although bears still seem to be in control, selling pressure could fade once bitcoin price hits support at the $300 mark. Bitcoin price could be due for a quick bounce if profit-taking takes place around the nearby major support zone. Breakdown Possible? Technical indicators seem to be indicating that bearish momentum could stay in play for much longer, as the short-term 100 SMA is below the longer-term 200 SMA. Stochastic is pointing down once more, after....
Bitcoin price could be ready to resume its drop if the nearby resistance levels are able to keep gains in check. Bitcoin Price Key Highlights. Bitcoin price recently made a strong downside break, signaling that bears are taking control. Price is making a short-term pullback to the broken near-term support, offering an opportunity for more sellers to hop in. Bitcoin is testing the area of interest at the $448-450 area, which might hold as resistance. Technical Indicators Signals. The 100 SMA is above the 200 SMA for now but the moving averages have inched close together, indicating that a....

Bitcoin has dropped from the strong resistance level of $227 following the announcement of the BitLicense regulations. After erasing the gains, Bitcoin was trading at $225.20 previously while today it is trading down 0.86% at $223.27. The question to be asked now is: Is there more downside left given that the biggest trigger has been digested by the market? I believe the answer is a Yes! Technical analysis of the 240-minute BTC-USD price chart confirms my bearish stance on Bitcoin. Bitcoin Chart Structure - Bulls' first attempt at keeping up the price has been easily thwarted by the bears....

At the current price of $247.66, Bitcoin is trading more than 2% down from its 24-hour high of $253.75. The downward trend is still evident in the digital currency and bears are entering the market on every rise. It is also expected that volatility will play a major role in the price action going ahead. Presented here is the technical analysis of the 240-minute BTC/USD price chart which makes a strong case for the sellers. Fibonacci Retracements - As can be seen from the chart above, the rise from yesterday's $245.27 to a high of $253.75 was considerably subdued by fresh selling.....

Litecoin has dropped 6.47 percent to trade at $2.733 as the underlying negativity comes to the fore. We discussed in the previous Litecoin price technical analysis The Pressure is Evident that there is a very low probability of the price trending higher and that bears may make an early comeback. This decline has also brought the price closer to its very important technical support of the 200-day simple moving average (SMA). The question that the trading community is now asking is: will this level cushion Litecoin once again? I continue to remain bearish on Bitcoin as well, which I believe....