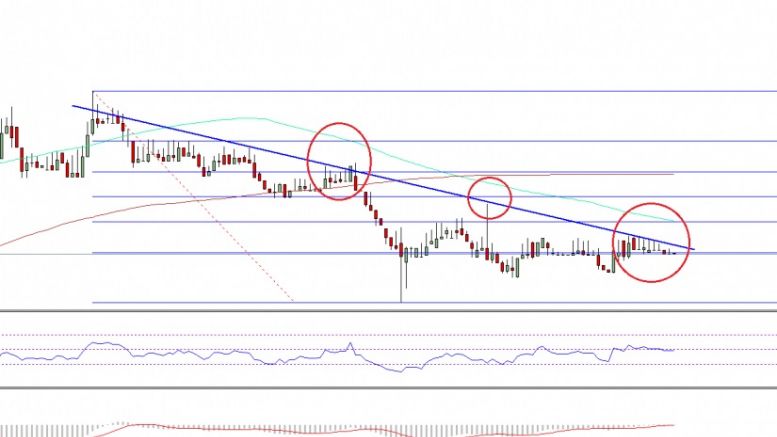
Ethereum Price Technical Analysis – Monstrous Resistance For ETH
Ethereum price ETH struggle to clear a monster resistance trend line continues. The buyers have to clear it in order to take the price higher. Key Highlights. ETH price failed once again to clear a major resistance area against the US Dollar, and was seen trading in a range. I highlighted a bearish trend line on the hourly chart (data feed via SimpleFX) of ETH/USD this week, which is still acting as a monstrous resistance for ETH. The price attempted at least 10 times to break it, but failed to gain traction. Ethereum Price Range. Ethereum price ETH attempted to clear a bearish trend line....
Related News

Key Highlights. Rubycoin's price dived down sharply after failing to break a major resistance area near 0.000511 BTC. After breaking a critical support trend line on the 4-hour chart (price feed from Bitfinex), there was a monstrous decline. After recovering a few points higher, the price declined and moved below the 0.00030 BTC support area. Rubycoin's price moved further down. There was an attempt by buyers to take the price higher, but it failed to sustain momentum. 0.0002 BTC as a Support Area. Rubycoin's price slide continued, and there was another leg down taking the price below a....

Key Highlights. Dash price rocketed higher and moved above a major hurdle of 0.0120BTC. There was more than 10% gain and there was a major bull trend noted as anticipated in one of the previous week's analyses. Dash price blasted higher and traded above several key resistance levels that ignited a monstrous ride this past week. Clear Uptrend. We were forecasting a major break for Dash price towards the upside, as most technical indicators were aligning in favor of bulls. There was a bearish trend line formed on the hourly chart, which was breached this past week. It ignited an upside move,....

Ethereum is trading very flat in a dull session as bitcoin remains undecided about the future direction. Currently at 0.00191BTC, Ethereum is in a no trade zone as discussed in the previous technical analysis. Sole Positive – The technical indicators are, however, rebounding from the respective oversold levels. I would like to discuss the resistance and support levels for Ethereum now. To serve this purpose, I will be using the 4-h ETH-XBT pair. Chart Structure – The pair has been registering lower tops and lower bottoms for the past 10 trading sessions. Connecting the two highs in this....

Key Highlights. As highlighted during the last week's analysis, Litecoin enjoyed a monstrous rally and currently consolidating gains. There is a chance of one more spike higher, but in that situation, it would be interesting to see how sellers react. Litecoin recent surge higher towards the $2.00 level was very impressive, but the price was just shy of the mentioned level and traded as high as $1.94. Currently, the price is consolidating and setting up for the next move. The Bollinger bands are shrinking and pointing that the price might move in a range after the mentioned monstrous rally.....

Ethereum Price Key Highlights. Ethereum price has been on a downtrend on its longer-term time frames, but it looks like the tides could turn. A double bottom pattern is visible on the 4-hour chart and price is making its way up to test the neckline at 0.0040. Ethereum price could be in for a long-term uptrend if it is able to break past the neckline resistance soon. Technical Indicators In Favor Of the Bulls. The technical indicators on the 4-hour time frame support further gains in ethereum price, as the 100 SMA just crossed above the 200 SMA. This signals that the path of least....