Ethereum Price Technical Analysis – Short-term Resistance
Ethereum price after completing a tiny correction versus the US Dollar gained bids at $10.80. Can it continue to move higher in the near term? Key Highlights. ETH price started a minor correction against the US Dollar yesterday and currently attempting to move back higher. There is a minor bearish trend line formed on the hourly chart (data feed via SimpleFX) of ETH/USD, which buyers need to break for an upside move. They also need to overcome the 100 hourly simple moving average, positioned just around the trend line. Ethereum Price Sighting Break. Ethereum price ETH started a correction....
Related News

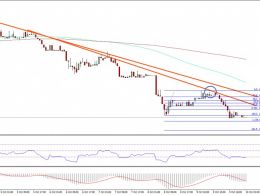
Ethereum Price Key Highlights. After forming a head and shoulders pattern indicated in yesterday's technical analysis article, ethereum price broke below the neckline and confirmed the potential selloff. Price also broke below the rising trend line support, adding to the downtrend signals on the 1-hour time frame. Ethereum price could have its sights set on the next visible floor around 0.0200, although a pullback to the broken neckline and trend line support might be seen. Resistance at 61.8% Fib? The 61.8% Fibonacci retracement level is closest to the broken rising trend line and is also....

Ethereum Price Key Highlights. Ethereum price appears to be creating a range on its 1-hour time frame, unable to sustain its momentum after an earlier breakout. Price found resistance at 0.00300 and support at the 0.00285 area. Ethereum price just bounced off the top of its range and may be ready to test the bottom once more. Ethereum price could continue with its sideways movement, as technical indicators aren't offering any signals for directional plays. Short-Term Profit Opportunities. With that, ethereum traders might simply go for short-term gains, buying off support and selling at....

Ethereum price looks like may struggle in the near term vs the USD, and if the ETH sellers step in, then a new weekly low may be established. Ethereum Price Bearish. Ethereum price ETH may be setting up for more losses in the short term vs the US Dollar, as it failed to move higher intraday. The price moved closer to the $12.80 where it found sellers and started to trade lower once again. There is a minor bearish trend line formed on the hourly chart (data feed via Kraken) of ETH/USD that acted as a resistance and pushed the price down. The price is currently trading close to the last....
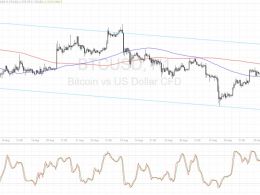
Bitcoin price could be ready to resume its selloff upon testing the descending channel resistance visible on its short-term charts. Bitcoin Price Key Highlights. Bitcoin price is still trending lower on its short-term time frames, moving inside a descending channel on its 1-hour chart. Price is on a climb but might be due for a selloff soon since it is already near the ceiling at the channel resistance. A short-term double-top can be seen, also suggesting a reversal from the recent rally. Technical Indicators Signals. The 100 SMA is below the 200 SMA on this time frame, which means that....
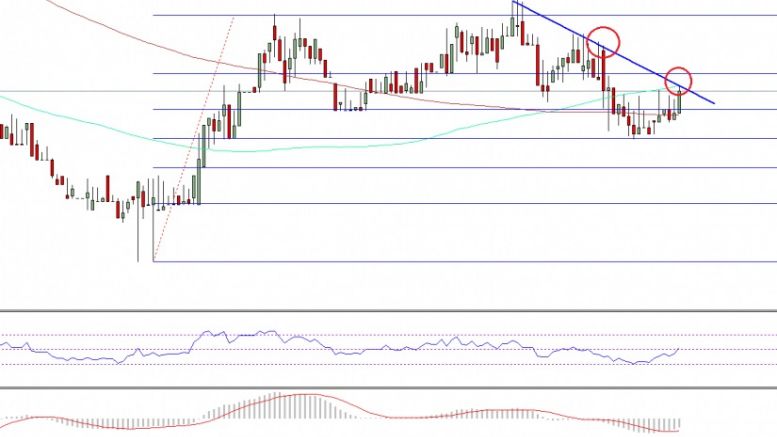
Ethereum price fell further, as the Eth sellers were seen in control. Going forward, there are chances of additional downsides in the short term. Key Highlights. ETH price continued to face sellers versus the US Dollar, and may move down further. There are two bearish trend lines formed on the hourly chart (data feed via SimpleFX) of ETH/USD, which are acting as a resistance. It looks like the pair may easily head towards the $11.60 level where the bulls may appear. Ethereum Price Resistance. Ethereum price remained under heavy selling pressure against the US Dollar this past week. I....