
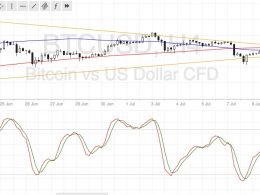
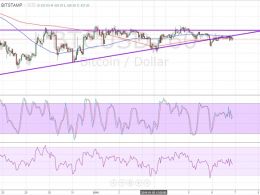
Bitcoin Price Technical Analysis for 09/09/2016 – Break and Retest?
Bitcoin price is pulling back from its recent breakout but the nearby inflection points could hold as support. Bitcoin Price Key Highlights. Bitcoin price recently made an upside break from its bullish continuation pattern, signaling that buyers are ready for more gains. Price seems to be pulling back to the broken short-term resistance before regaining momentum. There are plenty of support levels located nearby and these might be enough to keep the uptrend intact. Technical Indicators Signals. The 100 SMA is above the longer-term 200 SMA so the path of least resistance is to the upside....
Related News
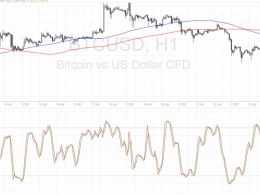
Bitcoin price could be due for a strong break out of its consolidation pattern, but traders still seem to be undecided which way to push. Bitcoin Price Technical Analysis. Bitcoin price is still stuck in its consolidation pattern visible on the 4-hour time frame. Price is already at the peak of the symmetrical triangle formation, which means that a breakout could take place anytime now. Technical indicators and market sentiment appear to be hinting at a downside break. Technical Indicators Signals. The 100 SMA is below the 200 SMA so the path of least resistance is to the downside. A....
Bitcoin price seems to be establishing a downtrend after confirming a reversal pattern, and technical indicators support this view. Bitcoin Price Key Highlights. Bitcoin price recently formed a head and shoulders pattern on its short-term time frames, signaling that the recent uptrend may be over. Price has broken below the neckline support, which held as resistance on the retest. This adds confirmation that further losses are possible so it’s time to look at the nearby inflection points and areas of interest for potential targets. Technical Indicators Signals. The 100 SMA is still below....
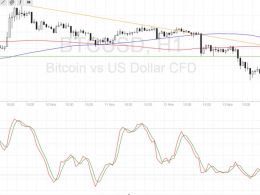
Bitcoin price is establishing a new downtrend after breaking below an area of interest. More bears are waiting at this retest of the broken support. Bitcoin Price Key Highlights. Bitcoin price recently broke below an area of interest marked in an earlier article, indicating that a downtrend might be due. Price is now pulling back up to this area for a retest before gaining more traction in its selloff. If the near-term resistance holds, bitcoin price could make its way back down to the recent lows at $685. Technical Indicators Signals. The 100 SMA is still above the 200 SMA for now but the....
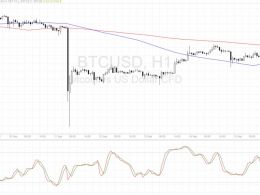
Bitcoin price just recently came off a quick drop and may be ready to resume its slide after this pullback. Bitcoin Price Key Highlights. Bitcoin price has formed lower highs recently, suggesting that a short-term drop may be in the cards. Price is making a quick pullback from its recent drop, possibly to make a retest of the broken support at the 100 SMA. Price is still hovering around an area of interest at this point so it could be anyone’s game. Technical Indicators Signals. The 100 SMA is still below the 200 SMA so the path of least resistance is to the downside. However, the gap....
The US dollar has been on a stronger footing against most of its peers at the start of this year, putting a bit of weight on bitcoin price. The Fed just came off a rate hike in December and might be looking to tighten again before the end of this quarter if economic data continues to surpass expectations. The FOMC minutes released yesterday confirmed that policymakers are noticing the signs of improvement in the labor market but are still doubtful that inflationary pressures could pickup. This week, the release of the NFP report could add fuel to the dollar’s fire if the actual results....