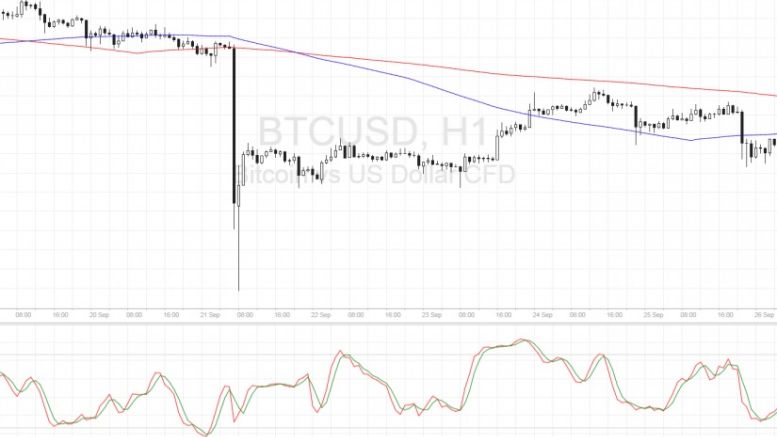
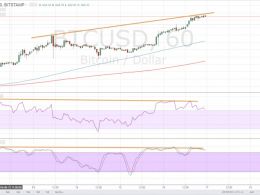
Bitcoin Price Technical Analysis for 09/26/2016 – Is a Selloff Brewing?
Bitcoin price just recently came off a quick drop and may be ready to resume its slide after this pullback. Bitcoin Price Key Highlights. Bitcoin price has formed lower highs recently, suggesting that a short-term drop may be in the cards. Price is making a quick pullback from its recent drop, possibly to make a retest of the broken support at the 100 SMA. Price is still hovering around an area of interest at this point so it could be anyone’s game. Technical Indicators Signals. The 100 SMA is still below the 200 SMA so the path of least resistance is to the downside. However, the gap....
Related News
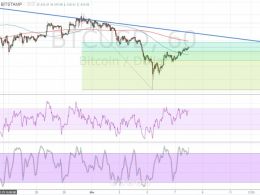
Bitcoin price could be due for another steady drop if the trend line and Fibonacci retracement levels hold as resistance. Applying the Fibonacci retracement tool on the latest swing high and low shows these resistance levels: 50% Fib at $411.66 and 61.8% Fib at $418.72, which is close to the trend line at $420. In addition, the 200 SMA could hold as a dynamic inflection point, keeping gains in check and allowing the selloff to resume as this lines up with an area of interest or former short-term support zone.
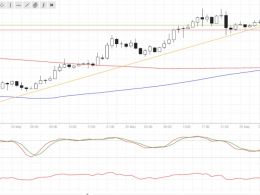
Bitcoin price made a break of the short-term trend line support, signaling a potential selloff from here. Bitcoin Price Key Highlights. Bitcoin price had been moving above an ascending trend line on its 1-hour time frame. Price just made a downside break of support as risk aversion seems to be back in the financial markets. This could be an early signal of a pending selloff, although technical indicators are still giving mixed signs. Technical Indicators Signals. The 100 SMA is starting to cross above the longer-term 200 SMA, which suggests potentially stronger buying pressure. If so,....
Bitcoin price made a downside break from the long-term consolidation pattern, signaling that a selloff is about to take place. Bitcoin Price Key Highlights. Bitcoin price has formed higher lows and lower highs, creating a symmetrical triangle consolidation pattern on its daily and 4-hour time frames. Price seems to have finally made a break below the triangle support, indicating that bears have taken control. If so, bitcoin could be due for a prolonged drop, possibly until the triangle bottoms at $350. Technical Indicators Signals. The 100 SMA is still above the 200 SMA on the daily time....
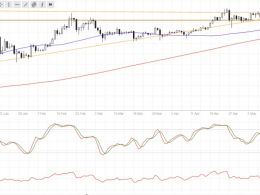
Bitcoin price could be due for a quick selloff at this point, as profit-taking might happen ahead of the weekend and next week’s EU referendum. Bitcoin Price Key Highlights. Bitcoin price has been on a tear these days but some technical indicators are hinting at an exhaustion. Price is closing in on the $800 level, which is an area of interest visible on longer-term time frames. If a selloff is seen at the current levels, it could find nearby support at $700. Technical Indicators Signals. The 100 SMA is above the 200 SMA for now so the path of least resistance is to the upside. In....
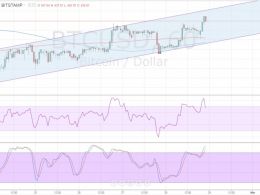
Bitcoin price is gradually trading higher inside an ascending channel and might be due to test the resistance near $445. Technical indicators suggest that bitcoin price might bounce off the top of the range, as RSI is starting to turn down from the overbought zone. Stochastic still seems to be on the move up but has just landed in overbought territory, indicating that buying pressure might fade soon. In addition, the 100 SMA is below the 200 SMA, suggesting that the path of least resistance is to the downside. However, an upward crossover appears to be brewing, which could mean that the....