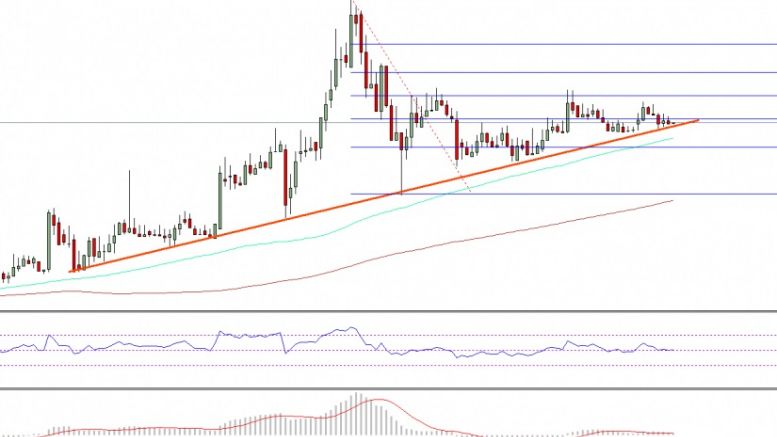
Ethereum Price Weekly Analysis – ETH/USD Testing Crucial Support
Ethereum price was under a lot of bearish pressure against the US dollar, and currently the bulls are fighting around a major support. Key Highlights. Ethereum price declined heavily versus the US Dollar, but currently trading near a crucial support. There is a critical bullish trend line formed on the daily chart of ETH/USD (data feed via SimpleFX), which may stop the downside going forward. The 100-day simple moving average is also on the downside to act as a support area. Ethereum Price Trend. Ethereum price ETH after staying above the $13.00 level against the US Dollar for some time,....
Related News
Ethereum price is currently under a correction mode and testing a support area versus the US Dollar. Can ETH/USD bounce sooner or later? Key Highlights. ETH price after trading as high as $13.34 versus the US Dollar traded lower and currently testing a crucial support. There is a major bullish trend line formed on the hourly chart (data feed via SimpleFX) of ETH/USD, which is currently acting as a support. The 100 hourly simple moving average is also currently providing support and protecting further declines. Ethereum Price Correction. Ethereum price yesterday spiked higher against the US....
The price of Cosmos (ATOM) could be set for a wild rally with a potential breakout against Tether (USDT) ahead of summer relief for altcoins. Ethereum price saw a relief bounce from $1,600 to $1,800 ahead of merge sentiments leading to other altcoins like Cosmos breaking out in price. (Data feeds from Binance) Related Reading: TA- Ethereum Price struggles To Breakout – Eyes $2,000 Price Analysis Of ATOM On The Weekly Chart From the chart, the price of ATOM saw a weekly low of around $6.5, which bounced from that range and rallied to $11.3. The price has built more momentum as it faces....
The price of Ethereum (ETH) has struggled to hold above $2,000 against Tether (USDT) after being rejected from that region. Ethereum price in the past few weeks outperformed the price of Bitcoin (BTC) but has shown bearish signs indicating the ETH price could be set to retest the nearest support. Related Reading: TA: Ethereum Could Take Hit As The Bulls Show Weak Hands Ethereum (ETH) Price Analysis On The Weekly Chart From the chart, the price of ETH saw a weekly low of $1,700, which bounced from that area and rallied to a price of $2,030 after showing great recovery signs in recent....
Coming out of weeks of downtrend, the Ethereum price could be looking to establish the next bottom as it sets up for a campaign toward new all-time highs. This is highlighted by crypto analyst MMBTtrader, who explained that the Ethereum price crash could be coming to an end. This is evidenced by a number of formations on the Ethereum price chart that suggest where the next lift-off might begin. Ethereum Price Is Testing The Next Major Support In an analysis shared on the TradingView website, the crypto analyst explained that the Ethereum price is now testing the next crucial technical....
Ethereum price is currently correcting lower and testing a major support, which must hold if ETH/USD has to remain in an uptrend. Key Highlights. ETH price after trading as high as $11.20 against the US Dollar found sellers and corrected lower. There is a crucial bullish trend line formed on the hourly chart (data feed via SimpleFX) of ETH/USD, which is acting as a major support. The same trend line is also around the 100 hourly simple moving average, acting as a buy area. Ethereum Price Trend Line Support. Ethereum price ETH managed to trade higher once again towards the $11.20 level....


