Bitcoin Price Technical Analysis for 10/31/2016 – Uptrend Still Intact!
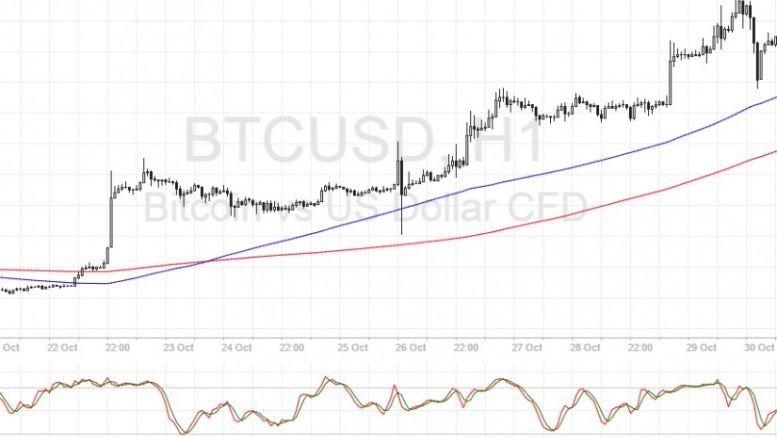
Bitcoin price gave up ground to the dollar on Friday but buyers soon returned at a key area of interest. Bitcoin Price Key Highlights. Bitcoin price sold off quickly on Friday but bulls were waiting to charge at the rising trend line. Price could resume its climb from here as technical indicators on the 1-hour time frame suggest that the uptrend could stay intact. A return in bullish pressure could push bitcoin up to the recent highs near $730 or higher. Technical Indicators Signals. The 100 SMA is above the longer-term 200 SMA on this time frame so the path of least resistance is still to....
Related News
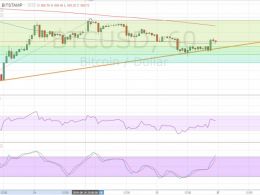
Bitcoin price appears to be pulling up from its post-Brexit surge but the short-term uptrend could remain intact. Bitcoin Price Technical Analysis. Bitcoin price made a strong surge on Friday as the UK voted to exit the EU. This could mean an extended period of uncertainty in the financial markets, lending more support for alternative assets like bitcoin. Price appears to be drawing support from the 50% Fibonacci retracement level on the 1-hour time frame and a rising trend line can be drawn to connect the lows since June 22. Technical Indicators Signals. The 100 SMA is below the 200 SMA....
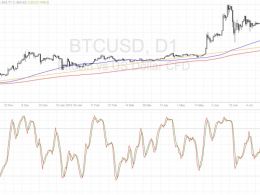
Bitcoin price is still hovering close to the long-term rising trend line but could be trying to resume its rally. Bitcoin Price Key Highlights. Bitcoin price has been trending higher on its longer-term time frames, moving above a rising trend line visible on the daily chart. Price recently tested the trend line support and made a bounce, which suggests that bulls are intent on keeping the uptrend intact. The rally is still finding legs but there are technical arguments for a continuation of the climb. Technical Indicators Signals. The 100 SMA is above the longer-term 200 SMA on this time....
Bitcoin price is in the middle of a pullback from its longer-term climb but might be ready to resume the uptrend if support holds. Bitcoin Price Key Highlights. Bitcoin price has been selling off in the past couple of days after breaking below a short-term rising trend line. The longer-term uptrend is still intact and bitcoin price is on its way to test a major support area. Technical indicators are suggesting that the uptrend could resume after this correction. Technical Indicators Signals. The 100 SMA is above the longer-term 200 SMA so the path of least resistance is still to the....
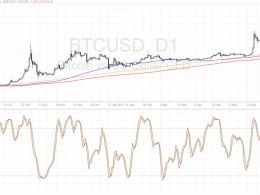
Bitcoin price could be due for a test of the longer-term rising trend line visible on the daily chart. Bitcoin Price Key Highlights. Bitcoin price recently made a strong break from a short-term consolidation pattern, signaling that sellers have taken control. However, the longer-term uptrend remains intact and price could be ready for a test of the key support. A rising trend line can be drawn to connect the lows on the daily time frame and bitcoin price seems to be headed towards this area. Technical Indicators Signals. On the daily time frame, the 100 SMA is above the 200 SMA so the....
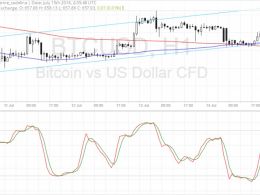
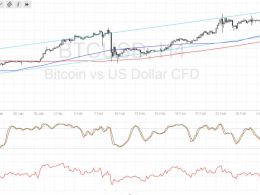
Bitcoin price is testing the ascending channel on the 1-hour time frame, still deciding whether to go for a continuation or a reversal. Bitcoin Price Key Highlights. Bitcoin price has been edging lower recently but the overall uptrend on the short-term chart seems intact. Price is still inside its ascending channel and is currently testing the support. A bounce could confirm that bulls are still in control of bitcoin price action while a breakdown would suggest that a downtrend is in order. Technical Indicators Signals. The 100 SMA is above the 200 SMA, which means that the the path of....