Ethereum Price Technical Analysis – ETH/USD Struggling Again?
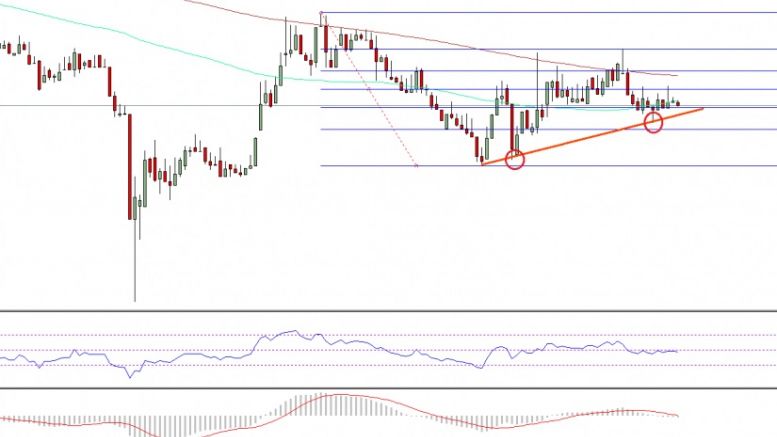
Ethereum price started a downside move once again after failing to close above $11.00. Can ETH/USD continue heading lower? Key Highlights. ETH price corrected higher towards $11.10 against the US Dollar, but failed to retest the last high of $11.35. It looks like the ETH/USD pair created a higher low, which is a signal of the price struggling in the short term. There is a minor bullish trend line formed on the hourly chart (data feed via SimpleFX) of ETH/USD, which must hold if the buyers want to stay in action. Ethereum Price Trend Line Support. ETH price started another wave higher....
Related News

The Christmas isn’t turning out to be merry for Bitcoin. The cryptocurrency is struggling near the overhead resistance of $465. It is now trading 1.28% lower at $450.89, raising concerns that the market participants might pull out their funds in the holiday season. As a result, several technical indicators are also showing declines. We advised in the previous Bitcoin price technical analysis Target Achieved that traders should book at least partial profits in their long positions. And for today’s analysis, we will again be using the 4-h BTC-USD price chart from BITSTAMP.
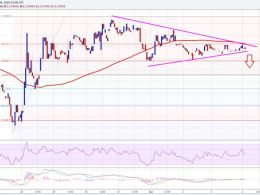
Ethereum price is struggling to trade higher, and approaching a short-term breakout. Can sellers succeed or the bulls will overcome selling pressure? Ethereum price after failing to break the $12.12 level against the US Dollar moved down, and showed a lot of bearish signs lately. The price closed below the 100 hourly simple moving average as well, which suggests that the bulls are struggling to take the price higher. There is a contracting triangle pattern forming on the hourly chart (data feed via Kraken) of ETH/USD, which may be seen as a catalyst for the next move. The highlighted....

Etheruem Price Key Highlights. Ethereum price is struggling to clear a major resistance area around 0.00390BTC-0.0040BTC. There is a bearish trend line formed on the hourly chart, which is acting as a hurdle for buyers. The price is struggling to settle above the 100 hourly simple moving average, which is a negative sign. Ethereum price is under a bearish pressure, as buyers failed on many occasions to break a major resistance trend line. Can it be broken? The Ethereum price was seen struggling many times to break a crucial bearish trend line formed on the hourly chart. There were at least....

A crypto analyst, who publishes technical analysis to his audience on X, has released a zoomed-out weekly Ethereum chart that interprets the current price weakness as the final stage of a multi-year accumulation cycle. As it stands, the Ethereum price is trading around $2,100 and 57% below its peak. Therefore, the technical analysis is suggesting that […]

Ethereum has started to show signs of life again after weeks of muted price action, but one analyst believes the current move is only the beginning of something much larger. This inclination is based on a technical setup built around a hidden inefficiency zone after the Ethereum price recently broke above $4,500. The technical analysis shows that the unfilled gap may be the first waypoint in a recovery that eventually pushes the ETH price to five figures above $10,000. The FVG Zone Now Acting As A Magnet Technical analysis done by crypto analyst Crypto Patel laid out a path to where the....