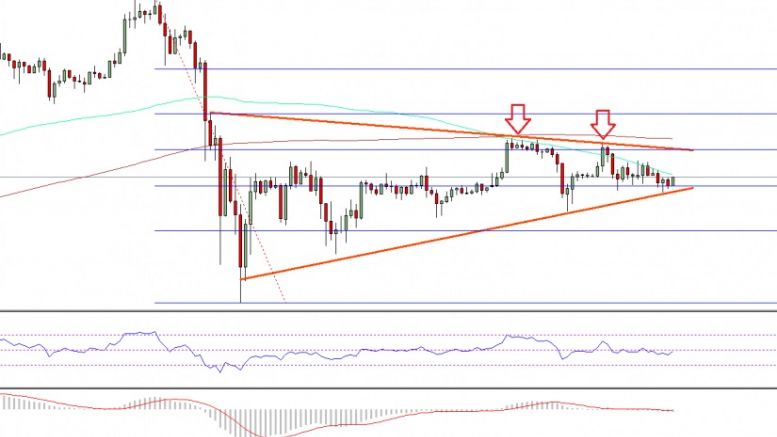
Bitcoin Price Technical Analysis – BTC/USD Approaching Break
Bitcoin price is currently trading in a range against the US Dollar, and it looks like the BTC/USD pair is approaching a crucial break ahead. Key Points. Bitcoin price after trading from $758 to $665 started a recovery and moved back above $700. There is a contracting triangle pattern formed on the hourly chart (data feed from SimpleFX) of BTC/USD, calling for a break. The price is currently trading above a crucial support area, which once broken may open the doors for more upsides. Bitcoin Price Range. There was a minor correction pattern in Bitcoin price during the past 2-3 days against....
Related News
Ethereum price is struggling to trade higher, and approaching a short-term breakout. Can sellers succeed or the bulls will overcome selling pressure? Ethereum price after failing to break the $12.12 level against the US Dollar moved down, and showed a lot of bearish signs lately. The price closed below the 100 hourly simple moving average as well, which suggests that the bulls are struggling to take the price higher. There is a contracting triangle pattern forming on the hourly chart (data feed via Kraken) of ETH/USD, which may be seen as a catalyst for the next move. The highlighted....

Following three consecutive sessions of declines, BTC was fast approaching its support level of $40,000 on Friday, as markets prepared for February’s nonfarm payrolls report. This came as ETH also fell lower, and is approaching its own floor of $2,500 in the process. Bitcoin BTC bulls have been few and far between over the last few days, as the world’s largest cryptocurrency faced growing pressure from bears. This pressure came following Tuesday’s climb to the resistance level of $45,000, which then triggered an onslaught of short sellers, who entered the market. As....
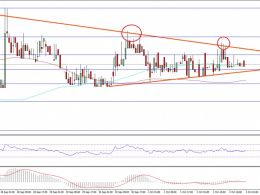
Ethereum price is currently trading in a range against the US Dollar, but with a positive tone and approaching a break soon. Key Highlights. ETH price mostly traded in a range versus the US Dollar during the past few sessions. There is a contracting triangle pattern forming on the hourly chart (data feed via SimpleFX) of ETH/USD, which may provide us a break soon. As long as the price is above the 100 hourly simple moving average, the chances of an upside break are high. Ethereum Price Resistance. Ethereum price after trading as high as $13.32 against the US Dollar started correcting....
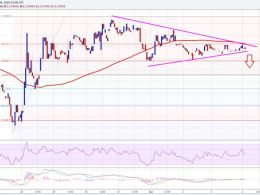
Bitcoin price is still moving in tight consolidation, but this appears to be a continuation signal from the previous strong move. Bitcoin Price Key Highlights. Bitcoin price is still stuck in consolidation, as traders are waiting for bigger market catalysts before deciding which direction to take. Keep in mind that bitcoin just recently made a strong rally, which makes the consolidation pattern a bullish flag. Technical indicators seem to be suggesting that an upside breakout is likely. Technical Indicators Signals. The 100 SMA is above the longer-term 200 SMA on this time frame,....

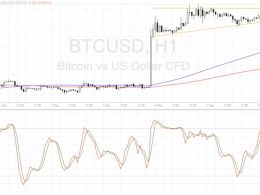
Bitcoin price, today, bounced off support once again, but the lack of higher highs and lower lows leaves continuing consolidation as the only likely option. A few breakpoints lie in price's path, and the first is approaching within the next 24 hours. This analysis is provided by xbt.social with a 3 hour delay. Read the full analysis here. Bitcoin Value and Price Analysis. Time of analysis: 14h23 UTC. Bitfinex 1-Hour Chart. In the 1-hour chart we see that price had bounced off support very convincingly on that last wave down. The indicators showed divergence for the end of the move and we....