
Litecoin Price Technical Analysis For 01/26/2016 – Perfect Sell Call
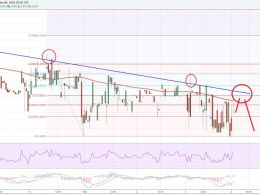
Litecoin price failed to hold gains, and started to fall. It looks like there is a chance of a dip towards the $3.00 support area moving ahead. Selling rallies can be preferred. Intraday Support Level (Bitfinex) may be at $3.00. I forecasted in yesterday’s post that there is a chance that the price may trade lower and test the channel support trend line formed on the hourly chart (data feed via Bitfinex). The price did move down, but even managed to clear the channel support area, which ignited a downside reaction. If someone followed our idea, then I think it’s time to take profits and....
Related News

The long call given in previous Litecoin price technical analysis Breakout has certainly paid off big. Litecoin price has jumped from $2.887 to hit an intraday high of $3.137, a huge addition of 8.66 percent. Even now, the momentum is looking very strong as Litecoin threatens to take out another key resistance level. Litecoin is currently trading at $3.110. Technically, Litecoin remains on a very strong footing but it runs a major risk as well - the risk of being quickly overbought. Read the latest values of the technical indicators below for further clarity. Litecoin Chart Structure -....
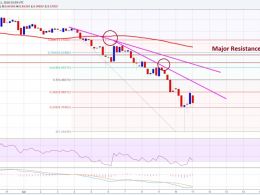
Litecoin price failed to trade higher. Our sell idea on the 30-min chart was a perfect deal as the price moved down towards $3.00. A Support Level (HitBTC) can be at $3.03. An important Resistance Level (HitBTC) may be $3.18. There were a few bearish signs noted on the 30-mins chart (data feed via Bitfinex) for Litecoin price, which played well and pushed the price down. There was a bullish trend line, which was broken to ignite a bear rally. Now, there is a bearish trend line formed on the same chart that acted as a barrier for buyers on many occasions, and it looks like there is a chance....

Litecoin rises 2.92 percent to $3.098 as it breaks away from the consolidation phase which lasted for 7 consecutive days. This is also the highest closing level for Litecoin in over a month. The rise in Litecoin could also be partly attributed to a strong surge in Bitcoin on the back of a strong momentum breakout. Helped by the price jump, Litecoin is now in the sniffing distance of a crucial overhead resistance which we discussed in the previous Litecoin analysis In a Fix? Below are the latest technical considerations taken from the daily LTC-USD price chart. Helped by the price jump,....
Ethereum price tumbled recently, and traded towards $8.00. It was a perfect sell, and it looks like the bulls may be exhausted. Ethereum price ETH was down and out, as there was a sharp downside move towards the $8.00 support area. I mentioned in my previous analysis that there is a chance of a decline in ETH/USD due to the technical indicators. It was a perfect sell, and the final target of $8.0 was achieved. There was a bearish trend line on the hourly chart (data feed via Kraken) of ETH/USD, which acted as a perfect catalyst for a decline. The price traded below $8.0, and a new low of....
Key Highlights. Litecoin price broke a major support area on the hourly chart (price feed from Bitfinex) and traded lower. Our initial sell target of $3.10 was achieved as forecasted in the recent technical analysis post. The price may attempt to correct higher in the short term and might face sellers near $3.15-20. Litecoin price moved lower sharply and failed to trade higher, suggesting that buyers are struggling to hold the ground. Support Turned Resistance. Finally, our previously highlighted $3.40 resistance area acted as a catalyst and pushed Litecoin price lower. A major support....