
Ethereum (ETH and ETC) Price Trends (Week of November 14th)
Ethereum’s price is again testing the bottom limit of the long-term flat. The beginning of a medium-term trend is therefore likely to grow under these conditions. ETH/USD. As was predicted last week, the large amount of buy stop orders has prevented the price from falling even lower. Instead, Ether’s price is steadily forming a sub-wave of the downward trend. At the moment, ETH has again reached the bottom limit of its long-term flat. There is a pretty large volume near $10. The sentiment of the majority of the bulls hasn’t changed from the beginning of previous week, and they still expect....
Related News
Litecoin price started last week by dropping from around $2.2 to $1.66, yet the momentum of the market changed as it started rising up again on the 1st of February. It's quite obvious how litecoin has been exhibiting a rather long bearish wave since it reached $48, its all-time high recorded back in 2013. To identify current resistance and support levels, we will draw a trend line between the high reached on the 13th of November, 2014 ($4.36) and the low reached on the 14th of January, 2015 ($1.13) and then plot the Fibonacci retracement accordingly on the 1 day Bitfinex (LTC/USD) charts....
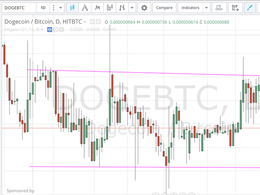
The price of Dogecoin declined over the past week (21st-27th of January) from 70 to 61 satoshis at the time of writing of this article. By studying the 1 day Hitbtc DOGE/BTC charts from tradingview.com (look at the below chart), we can clearly see a bullish rally that pushed the price of Doge up to around 74 satoshis on the 14th and 15th of January; this coincided with the fall in the price of bitcoin which dropped to $162 on the 14th of January. Since last November, the price of Dogecoin seems to have been oscillating between 70 and 51 satoshis (look at the 2 pink trend lines on the below....
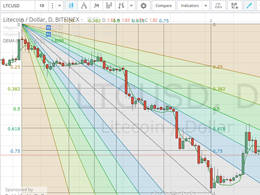
Litecoin price was greatly affected by the uncertainty that hit the bitcoin market last week, so although the week started by a small bullish wave that drove the price up to a high of about $2.00, the market's buying power failed to support this advance and the price fell to reach a low of around $1.7 on the 5th of February. By studying the 1 day Bitfinex (LTC/USD) chart from tradingview.com and plotting the Fibonacci retracement fan along a trend line that extends between the high reached on the 13th of November ($4.36) and the low reached on the 14th of January ($1.09) (look at the below....

Bitcoin's price over the past week was a scene of panic for many, but also jubilation for some, as it plummeted by over $100 over two days, only to quickly regain half of those losses. The well-prepared trader would have profited from this intense volatility. The bitcoin price opened the week at $267.09 and closed at $209.63, according to the CoinDesk Bitcoin Price Index. That's a loss of $57.46 or 22% over the seven days. The biggest story, of course, was the price crash in the first days of the week, when the price lost 37% of its value in two days, hitting a low of $170.21 on Wednesday,....

Dogecoin closed out the week strong with an 8% pump on Sunday August 14th, up around 14% in total on its weekly candle. Heading into the latter half of the month the Dogecoin price is now up 60% from its lows – however Ethereum is up over 120% since crashing to $880, hitting just over […]